

Spatial Shift in Chickpeas in India
413
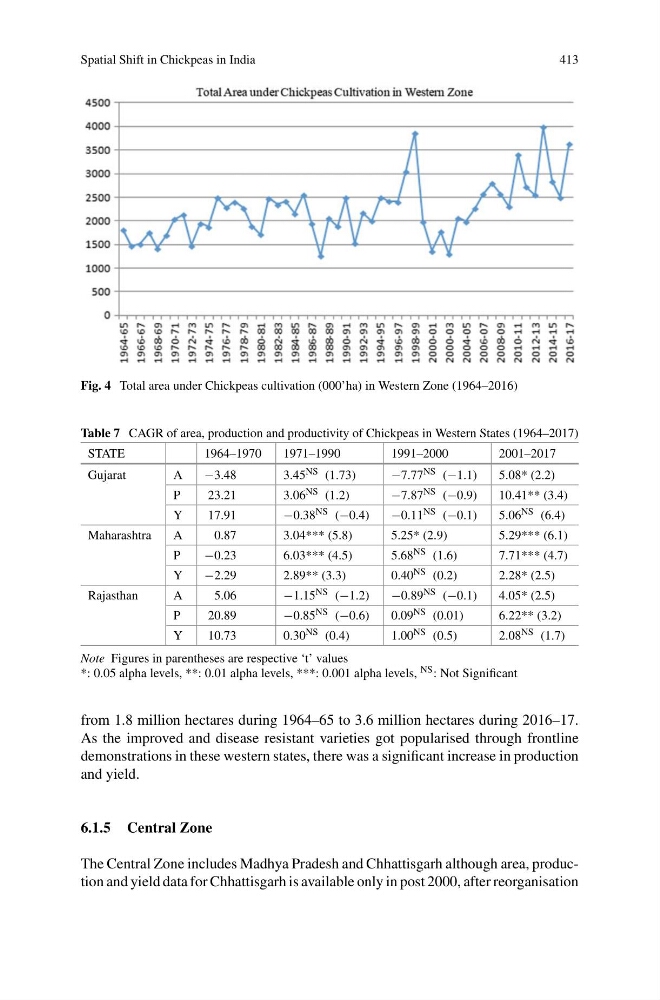
Fig. 4 Total area under Chickpeas cultivation (000’ha) in Western Zone (1964–2016)
Table 7 CAGR of area, production and productivity of Chickpeas in Western States (1964–2017)
STATE
1964–1970
1971–1990
1991–2000
2001–2017
Gujarat
A
−3.48
3.45 NS (1.73)
−7.77 NS (−1.1)
5.08* (2.2)
P
23.21
3.06 NS (1.2)
−7.87 NS (−0.9)
10.41** (3.4)
Y
17.91
−0.38 NS (−0.4)
−0.11 NS (−0.1)
5.06 NS (6.4)
Maharashtra
A
0.87
3.04*** (5.8)
5.25* (2.9)
5.29*** (6.1)
P
−0.23
6.03*** (4.5)
5.68 NS (1.6)
7.71*** (4.7)
Y
−2.29
2.89** (3.3)
0.40 NS (0.2)
2.28* (2.5)
Rajasthan
A
5.06
−1.15 NS (−1.2)
−0.89 NS (−0.1)
4.05* (2.5)
P
20.89
−0.85 NS (−0.6)
0.09 NS (0.01)
6.22** (3.2)
Y
10.73
0.30 NS (0.4)
1.00 NS (0.5)
2.08 NS (1.7)
Note Figures in parentheses are respective ‘t’ values
*: 0.05 alpha levels, **: 0.01 alpha levels, ***: 0.001 alpha levels, NS : Not Significant
from 1.8 million hectares during 1964–65 to 3.6 million hectares during 2016–17.
As the improved and disease resistant varieties got popularised through frontline
demonstrations in these western states, there was a significant increase in production
and yield.
6.1.5 Central Zone
The Central Zone includes Madhya Pradesh and Chhattisgarh although area, production and yield data for Chhattisgarh is available only in post 2000, after reorganisation
413
Fig. 4 Total area under Chickpeas cultivation (000’ha) in Western Zone (1964–2016)
Table 7 CAGR of area, production and productivity of Chickpeas in Western States (1964–2017)
STATE
1964–1970
1971–1990
1991–2000
2001–2017
Gujarat
A
−3.48
3.45 NS (1.73)
−7.77 NS (−1.1)
5.08* (2.2)
P
23.21
3.06 NS (1.2)
−7.87 NS (−0.9)
10.41** (3.4)
Y
17.91
−0.38 NS (−0.4)
−0.11 NS (−0.1)
5.06 NS (6.4)
Maharashtra
A
0.87
3.04*** (5.8)
5.25* (2.9)
5.29*** (6.1)
P
−0.23
6.03*** (4.5)
5.68 NS (1.6)
7.71*** (4.7)
Y
−2.29
2.89** (3.3)
0.40 NS (0.2)
2.28* (2.5)
Rajasthan
A
5.06
−1.15 NS (−1.2)
−0.89 NS (−0.1)
4.05* (2.5)
P
20.89
−0.85 NS (−0.6)
0.09 NS (0.01)
6.22** (3.2)
Y
10.73
0.30 NS (0.4)
1.00 NS (0.5)
2.08 NS (1.7)
Note Figures in parentheses are respective ‘t’ values
*: 0.05 alpha levels, **: 0.01 alpha levels, ***: 0.001 alpha levels, NS : Not Significant
from 1.8 million hectares during 1964–65 to 3.6 million hectares during 2016–17.
As the improved and disease resistant varieties got popularised through frontline
demonstrations in these western states, there was a significant increase in production
and yield.
6.1.5 Central Zone
The Central Zone includes Madhya Pradesh and Chhattisgarh although area, production and yield data for Chhattisgarh is available only in post 2000, after reorganisation