

Spatial Shift in Chickpeas in India
407
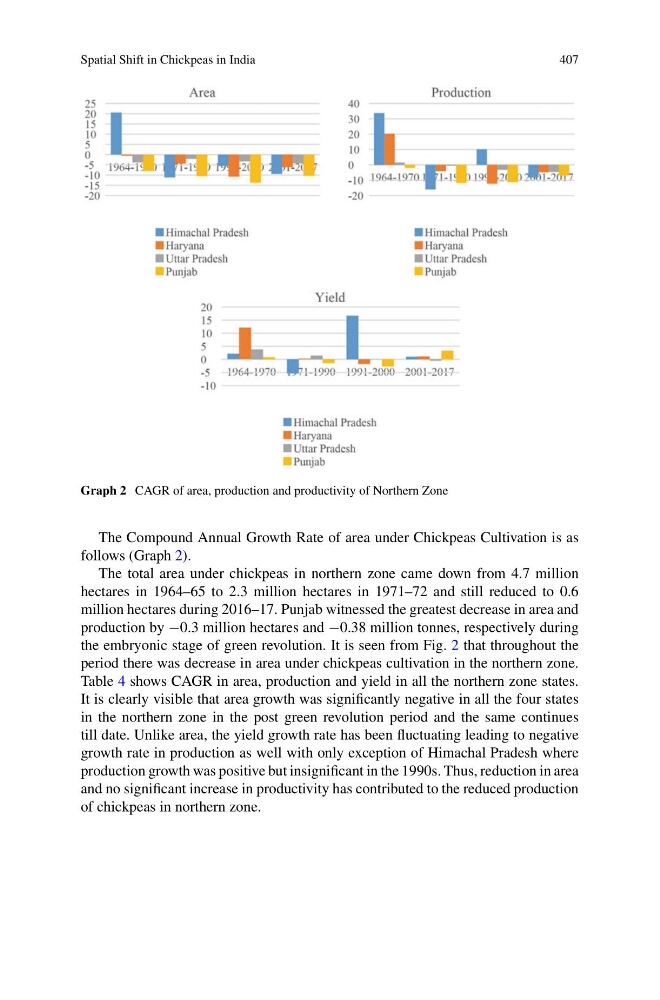
Graph 2 CAGR of area, production and productivity of Northern Zone
The Compound Annual Growth Rate of area under Chickpeas Cultivation is as
follows (Graph 2).
The total area under chickpeas in northern zone came down from 4.7 million
hectares in 1964–65 to 2.3 million hectares in 1971–72 and still reduced to 0.6
million hectares during 2016–17. Punjab witnessed the greatest decrease in area and
production by −0.3 million hectares and −0.38 million tonnes, respectively during
the embryonic stage of green revolution. It is seen from Fig. 2 that throughout the
period there was decrease in area under chickpeas cultivation in the northern zone.
Table 4 shows CAGR in area, production and yield in all the northern zone states.
It is clearly visible that area growth was significantly negative in all the four states
in the northern zone in the post green revolution period and the same continues
till date. Unlike area, the yield growth rate has been fluctuating leading to negative
growth rate in production as well with only exception of Himachal Pradesh where
production growth was positive but insignificant in the 1990s. Thus, reduction in area
and no significant increase in productivity has contributed to the reduced production
of chickpeas in northern zone.
407
Graph 2 CAGR of area, production and productivity of Northern Zone
The Compound Annual Growth Rate of area under Chickpeas Cultivation is as
follows (Graph 2).
The total area under chickpeas in northern zone came down from 4.7 million
hectares in 1964–65 to 2.3 million hectares in 1971–72 and still reduced to 0.6
million hectares during 2016–17. Punjab witnessed the greatest decrease in area and
production by −0.3 million hectares and −0.38 million tonnes, respectively during
the embryonic stage of green revolution. It is seen from Fig. 2 that throughout the
period there was decrease in area under chickpeas cultivation in the northern zone.
Table 4 shows CAGR in area, production and yield in all the northern zone states.
It is clearly visible that area growth was significantly negative in all the four states
in the northern zone in the post green revolution period and the same continues
till date. Unlike area, the yield growth rate has been fluctuating leading to negative
growth rate in production as well with only exception of Himachal Pradesh where
production growth was positive but insignificant in the 1990s. Thus, reduction in area
and no significant increase in productivity has contributed to the reduced production
of chickpeas in northern zone.