

Spatial Shift in Chickpeas in India
405
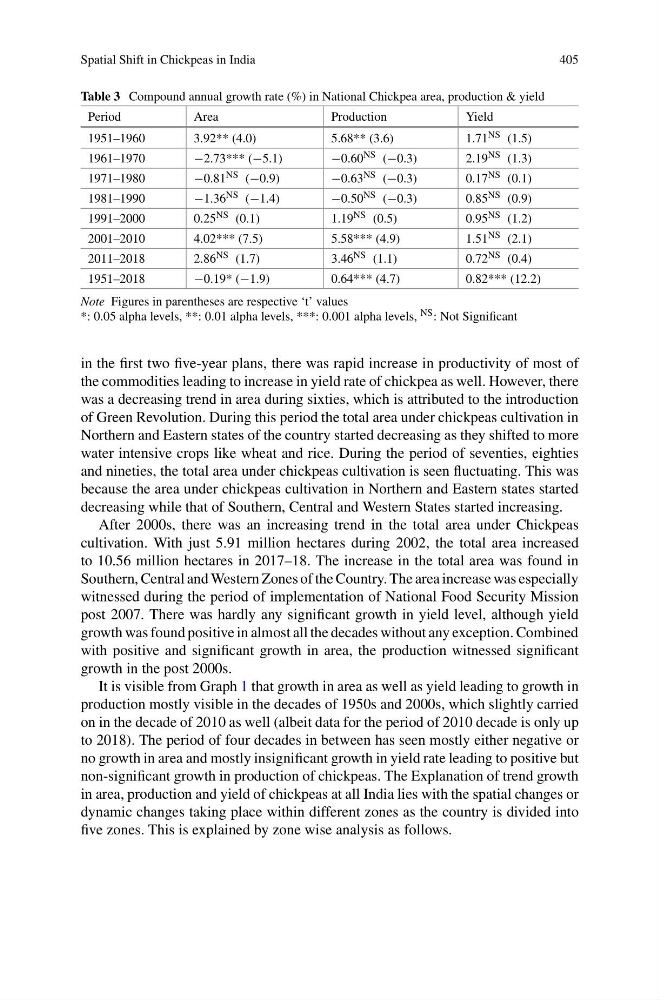
Table 3 Compound annual growth rate (%) in National Chickpea area, production & yield
Period
Area
Production
Yield
1951–1960
3.92** (4.0)
5.68** (3.6)
1.71 NS (1.5)
1961–1970
−2.73*** (−5.1)
−0.60 NS (−0.3)
2.19 NS (1.3)
1971–1980
−0.81 NS (−0.9)
−0.63 NS (−0.3)
0.17 NS (0.1)
1981–1990
−1.36 NS (−1.4)
−0.50 NS (−0.3)
0.85 NS (0.9)
1991–2000
0.25 NS (0.1)
1.19 NS (0.5)
0.95 NS (1.2)
2001–2010
4.02*** (7.5)
5.58*** (4.9)
1.51 NS (2.1)
2011–2018
2.86 NS (1.7)
3.46 NS (1.1)
0.72 NS (0.4)
1951–2018
−0.19* (−1.9)
0.64*** (4.7)
0.82*** (12.2)
Note Figures in parentheses are respective ‘t’ values
*: 0.05 alpha levels, **: 0.01 alpha levels, ***: 0.001 alpha levels, NS : Not Significant
in the first two five-year plans, there was rapid increase in productivity of most of
the commodities leading to increase in yield rate of chickpea as well. However, there
was a decreasing trend in area during sixties, which is attributed to the introduction
of Green Revolution. During this period the total area under chickpeas cultivation in
Northern and Eastern states of the country started decreasing as they shifted to more
water intensive crops like wheat and rice. During the period of seventies, eighties
and nineties, the total area under chickpeas cultivation is seen fluctuating. This was
because the area under chickpeas cultivation in Northern and Eastern states started
decreasing while that of Southern, Central and Western States started increasing.
After 2000s, there was an increasing trend in the total area under Chickpeas
cultivation. With just 5.91 million hectares during 2002, the total area increased
to 10.56 million hectares in 2017–18. The increase in the total area was found in
Southern, Central and Western Zones of the Country. The area increase was especially
witnessed during the period of implementation of National Food Security Mission
post 2007. There was hardly any significant growth in yield level, although yield
growth was found positive in almost all the decades without any exception. Combined
with positive and significant growth in area, the production witnessed significant
growth in the post 2000s.
It is visible from Graph 1 that growth in area as well as yield leading to growth in
production mostly visible in the decades of 1950s and 2000s, which slightly carried
on in the decade of 2010 as well (albeit data for the period of 2010 decade is only up
to 2018). The period of four decades in between has seen mostly either negative or
no growth in area and mostly insignificant growth in yield rate leading to positive but
non-significant growth in production of chickpeas. The Explanation of trend growth
in area, production and yield of chickpeas at all India lies with the spatial changes or
dynamic changes taking place within different zones as the country is divided into
five zones. This is explained by zone wise analysis as follows.
405
Table 3 Compound annual growth rate (%) in National Chickpea area, production & yield
Period
Area
Production
Yield
1951–1960
3.92** (4.0)
5.68** (3.6)
1.71 NS (1.5)
1961–1970
−2.73*** (−5.1)
−0.60 NS (−0.3)
2.19 NS (1.3)
1971–1980
−0.81 NS (−0.9)
−0.63 NS (−0.3)
0.17 NS (0.1)
1981–1990
−1.36 NS (−1.4)
−0.50 NS (−0.3)
0.85 NS (0.9)
1991–2000
0.25 NS (0.1)
1.19 NS (0.5)
0.95 NS (1.2)
2001–2010
4.02*** (7.5)
5.58*** (4.9)
1.51 NS (2.1)
2011–2018
2.86 NS (1.7)
3.46 NS (1.1)
0.72 NS (0.4)
1951–2018
−0.19* (−1.9)
0.64*** (4.7)
0.82*** (12.2)
Note Figures in parentheses are respective ‘t’ values
*: 0.05 alpha levels, **: 0.01 alpha levels, ***: 0.001 alpha levels, NS : Not Significant
in the first two five-year plans, there was rapid increase in productivity of most of
the commodities leading to increase in yield rate of chickpea as well. However, there
was a decreasing trend in area during sixties, which is attributed to the introduction
of Green Revolution. During this period the total area under chickpeas cultivation in
Northern and Eastern states of the country started decreasing as they shifted to more
water intensive crops like wheat and rice. During the period of seventies, eighties
and nineties, the total area under chickpeas cultivation is seen fluctuating. This was
because the area under chickpeas cultivation in Northern and Eastern states started
decreasing while that of Southern, Central and Western States started increasing.
After 2000s, there was an increasing trend in the total area under Chickpeas
cultivation. With just 5.91 million hectares during 2002, the total area increased
to 10.56 million hectares in 2017–18. The increase in the total area was found in
Southern, Central and Western Zones of the Country. The area increase was especially
witnessed during the period of implementation of National Food Security Mission
post 2007. There was hardly any significant growth in yield level, although yield
growth was found positive in almost all the decades without any exception. Combined
with positive and significant growth in area, the production witnessed significant
growth in the post 2000s.
It is visible from Graph 1 that growth in area as well as yield leading to growth in
production mostly visible in the decades of 1950s and 2000s, which slightly carried
on in the decade of 2010 as well (albeit data for the period of 2010 decade is only up
to 2018). The period of four decades in between has seen mostly either negative or
no growth in area and mostly insignificant growth in yield rate leading to positive but
non-significant growth in production of chickpeas. The Explanation of trend growth
in area, production and yield of chickpeas at all India lies with the spatial changes or
dynamic changes taking place within different zones as the country is divided into
five zones. This is explained by zone wise analysis as follows.