

Climate Change and Adaptation Strategies in the Gir Kesar …
383
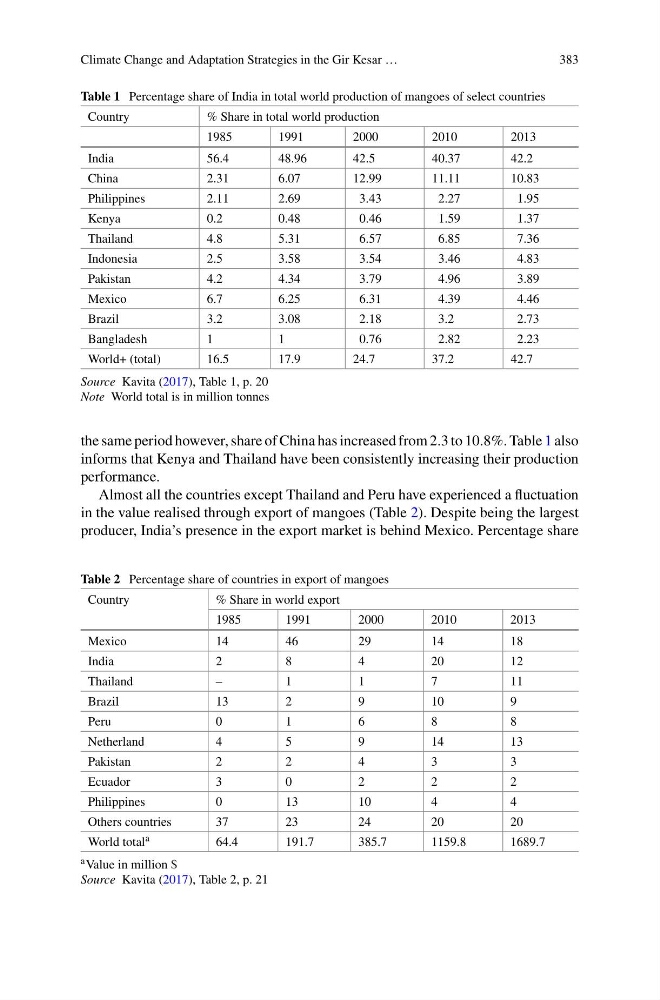
Table 1 Percentage share of India in total world production of mangoes of select countries
Country
% Share in total world production
1985
1991
2000
2010
2013
India
56.4
48.96
42.5
40.37
42.2
China
2.31
6.07
12.99
11.11
10.83
Philippines
2.11
2.69
3.43
2.27
1.95
Kenya
0.2
0.48
0.46
1.59
1.37
Thailand
4.8
5.31
6.57
6.85
7.36
Indonesia
2.5
3.58
3.54
3.46
4.83
Pakistan
4.2
4.34
3.79
4.96
3.89
Mexico
6.7
6.25
6.31
4.39
4.46
Brazil
3.2
3.08
2.18
3.2
2.73
Bangladesh
1
1
0.76
2.82
2.23
World+ (total)
16.5
17.9
24.7
37.2
42.7
Source Kavita (2017), Table 1, p. 20
Note World total is in million tonnes
the same period however, share of China has increased from 2.3 to 10.8%. Table 1 also
informs that Kenya and Thailand have been consistently increasing their production
performance.
Almost all the countries except Thailand and Peru have experienced a fluctuation
in the value realised through export of mangoes (Table 2). Despite being the largest
producer, India’s presence in the export market is behind Mexico. Percentage share
Table 2 Percentage share of countries in export of mangoes
Country
% Share in world export
1985
1991
2000
2010
2013
Mexico
14
46
29
14
18
India
2
8
4
20
12
Thailand
–
1
1
7
11
Brazil
13
2
9
10
9
Peru
0
1
6
8
8
Netherland
4
5
9
14
13
Pakistan
2
2
4
3
3
Ecuador
3
0
2
2
2
Philippines
0
13
10
4
4
Others countries
37
23
24
20
20
World total a
64.4
191.7
385.7
1159.8
1689.7
a Value in million $
Source Kavita (2017), Table 2, p. 21
383
Table 1 Percentage share of India in total world production of mangoes of select countries
Country
% Share in total world production
1985
1991
2000
2010
2013
India
56.4
48.96
42.5
40.37
42.2
China
2.31
6.07
12.99
11.11
10.83
Philippines
2.11
2.69
3.43
2.27
1.95
Kenya
0.2
0.48
0.46
1.59
1.37
Thailand
4.8
5.31
6.57
6.85
7.36
Indonesia
2.5
3.58
3.54
3.46
4.83
Pakistan
4.2
4.34
3.79
4.96
3.89
Mexico
6.7
6.25
6.31
4.39
4.46
Brazil
3.2
3.08
2.18
3.2
2.73
Bangladesh
1
1
0.76
2.82
2.23
World+ (total)
16.5
17.9
24.7
37.2
42.7
Source Kavita (2017), Table 1, p. 20
Note World total is in million tonnes
the same period however, share of China has increased from 2.3 to 10.8%. Table 1 also
informs that Kenya and Thailand have been consistently increasing their production
performance.
Almost all the countries except Thailand and Peru have experienced a fluctuation
in the value realised through export of mangoes (Table 2). Despite being the largest
producer, India’s presence in the export market is behind Mexico. Percentage share
Table 2 Percentage share of countries in export of mangoes
Country
% Share in world export
1985
1991
2000
2010
2013
Mexico
14
46
29
14
18
India
2
8
4
20
12
Thailand
–
1
1
7
11
Brazil
13
2
9
10
9
Peru
0
1
6
8
8
Netherland
4
5
9
14
13
Pakistan
2
2
4
3
3
Ecuador
3
0
2
2
2
Philippines
0
13
10
4
4
Others countries
37
23
24
20
20
World total a
64.4
191.7
385.7
1159.8
1689.7
a Value in million $
Source Kavita (2017), Table 2, p. 21