

342
R. Mandal and M. Sarma
Table 3 Descriptive statistics of the explanatory variables
Non-categorical variables
Unit
Mean
Std. dev.
Min.
Max.
Weather shock (WS)
Percentage
−24.10
36.74
−99.67
145.58
Household size (HS)
Number
4.85
2.32
1
33
Per capita income (PCI)
INR
29,402
53,996
−2,89,008
41,61,000
Dependency ratio (DR)
Percentage
76.09
74.42
0
80
Categorical variables
Definition
% age
Poor (Pov)
= 1 for sample households who are poor, 0
otherwise
16.41
Urban (Ur)
= 1 for sample households who live in urban
areas, 0 otherwise
34.57
Other Backward Classes (OBC)
= 1 for sample households who belong to
OBC category, 0 otherwise
40.46
Scheduled Castes (SC)
= 1 for sample households who belong to
SC category, 0 otherwise
21.21
Scheduled Tribes (ST)
= 1 for sample households who belong to
ST category, 0 otherwise
8.64
Other Caste (OC) a
= 1 for sample households who belong to
other category (excluding General caste), 0
otherwise
1.34
Religion (Hindu)
= 1 for Hindu sample households, 0
otherwise
81.61
Remittance (Remit)
= 1 if a household receives remittance, 0
otherwise
13.28
Main occupation (Cultivation)
= 1 if the main occupation of a household is
cultivation, 0 otherwise
24.41
Note a Excluding General Caste, which is taken as the reference category
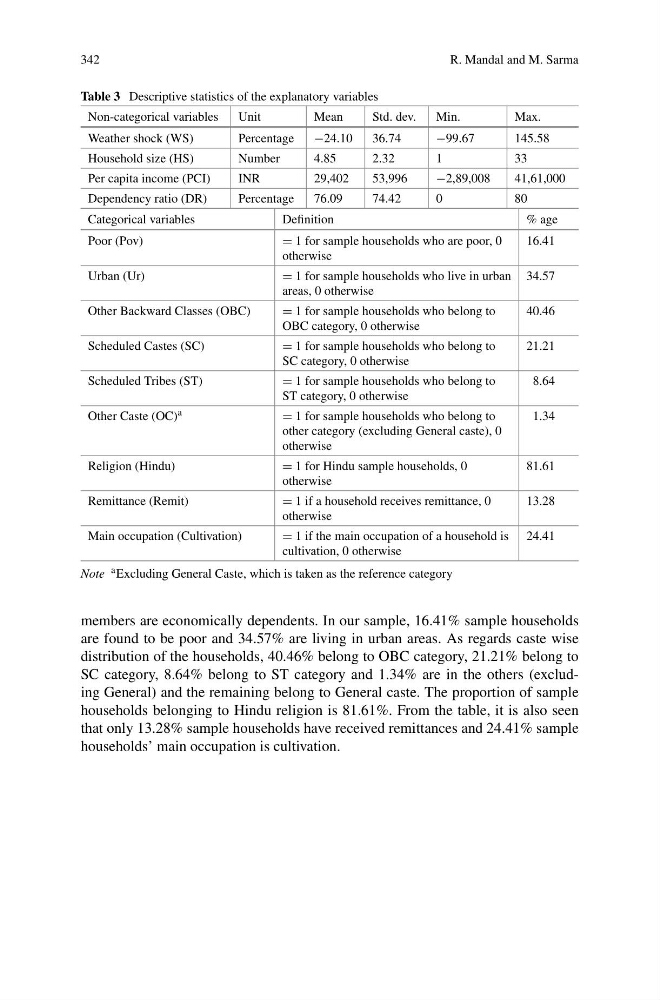
members are economically dependents. In our sample, 16.41% sample households
are found to be poor and 34.57% are living in urban areas. As regards caste wise
distribution of the households, 40.46% belong to OBC category, 21.21% belong to
SC category, 8.64% belong to ST category and 1.34% are in the others (excluding General) and the remaining belong to General caste. The proportion of sample
households belonging to Hindu religion is 81.61%. From the table, it is also seen
that only 13.28% sample households have received remittances and 24.41% sample
households’ main occupation is cultivation.
R. Mandal and M. Sarma
Table 3 Descriptive statistics of the explanatory variables
Non-categorical variables
Unit
Mean
Std. dev.
Min.
Max.
Weather shock (WS)
Percentage
−24.10
36.74
−99.67
145.58
Household size (HS)
Number
4.85
2.32
1
33
Per capita income (PCI)
INR
29,402
53,996
−2,89,008
41,61,000
Dependency ratio (DR)
Percentage
76.09
74.42
0
80
Categorical variables
Definition
% age
Poor (Pov)
= 1 for sample households who are poor, 0
otherwise
16.41
Urban (Ur)
= 1 for sample households who live in urban
areas, 0 otherwise
34.57
Other Backward Classes (OBC)
= 1 for sample households who belong to
OBC category, 0 otherwise
40.46
Scheduled Castes (SC)
= 1 for sample households who belong to
SC category, 0 otherwise
21.21
Scheduled Tribes (ST)
= 1 for sample households who belong to
ST category, 0 otherwise
8.64
Other Caste (OC) a
= 1 for sample households who belong to
other category (excluding General caste), 0
otherwise
1.34
Religion (Hindu)
= 1 for Hindu sample households, 0
otherwise
81.61
Remittance (Remit)
= 1 if a household receives remittance, 0
otherwise
13.28
Main occupation (Cultivation)
= 1 if the main occupation of a household is
cultivation, 0 otherwise
24.41
Note a Excluding General Caste, which is taken as the reference category
members are economically dependents. In our sample, 16.41% sample households
are found to be poor and 34.57% are living in urban areas. As regards caste wise
distribution of the households, 40.46% belong to OBC category, 21.21% belong to
SC category, 8.64% belong to ST category and 1.34% are in the others (excluding General) and the remaining belong to General caste. The proportion of sample
households belonging to Hindu religion is 81.61%. From the table, it is also seen
that only 13.28% sample households have received remittances and 24.41% sample
households’ main occupation is cultivation.