

Exploring Synergistic Inter Linkages Among Three Ecological …
275
comprehensively summarize the synergistic effect of climate change on eutrophication and species invasion understood the current literature survey. The phenomena
are valid only for aquatic ecosystems affected by eutrophication or species invasion
or both the issues. One or more of the phenomena can occur in a particular ecosystem,
depending upon its ecological condition.
A. Climate change facilitates eutrophication by increasing nutrient input.
B. Climate change accelerates the symptoms of eutrophication.
C. Climate change facilitates the introduction of invasive species.
D. Climate change accelerates propagation of invasive species and their negative
impacts.
E. Species invasion leads to eutrophication.
F. Eutrophication leads to species invasion.
3.4.2 Ecosystem Categories and Scores
I consider six categories of ecosystems (I–VI) for analysis. These categories have
been proposed to convert qualitative information into quantitative data on the basis
of the six selected phenomena (A–F). This proposition is based on the categorization
used by Dutta (2018).
Category I ecosystems are the ones in which any one of the six phenomena
have taken place (A, B, C, D, E or F). Thus, there could be six different types
of affected ecosystems in this category. So, this category has been assigned a score
of 06 (Table 1).
In Category II ecosystems, any two out of the six phenomena have occurred. As
calculated in MS Excel, the six phenomena can occur in 15 different combinations
whenever any two phenomena are grouped together (A + B, A + C, A + D, A + E,
A + F, B + C, B + D, B + E, B + F, C + D, C + E, C + F, D + E, D + F, E + F).
Thus, there could be 15 different types of affected ecosystems in this category. So,
this category has been assigned a score of 15. Similarly, the scores of the categories
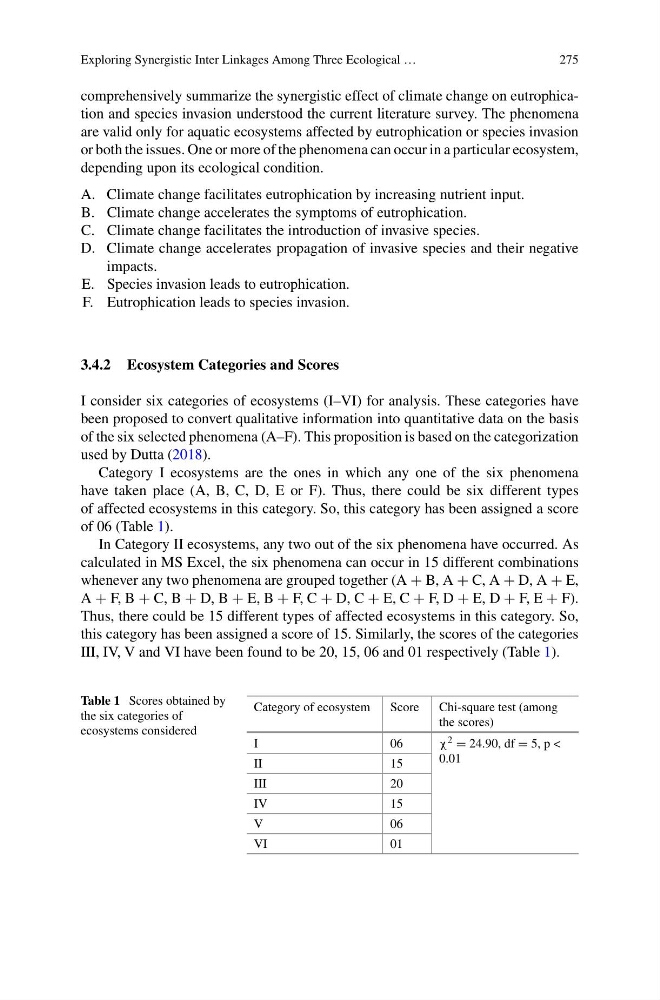
III, IV, V and VI have been found to be 20, 15, 06 and 01 respectively (Table 1).
Table 1 Scores obtained by
the six categories of
ecosystems considered
Category of ecosystem
Score
Chi-square test (among
the scores)
I
06
χ 2 = 24.90, df = 5, p <
0.01
II
15
III
20
IV
15
V
06
VI
01
275
comprehensively summarize the synergistic effect of climate change on eutrophication and species invasion understood the current literature survey. The phenomena
are valid only for aquatic ecosystems affected by eutrophication or species invasion
or both the issues. One or more of the phenomena can occur in a particular ecosystem,
depending upon its ecological condition.
A. Climate change facilitates eutrophication by increasing nutrient input.
B. Climate change accelerates the symptoms of eutrophication.
C. Climate change facilitates the introduction of invasive species.
D. Climate change accelerates propagation of invasive species and their negative
impacts.
E. Species invasion leads to eutrophication.
F. Eutrophication leads to species invasion.
3.4.2 Ecosystem Categories and Scores
I consider six categories of ecosystems (I–VI) for analysis. These categories have
been proposed to convert qualitative information into quantitative data on the basis
of the six selected phenomena (A–F). This proposition is based on the categorization
used by Dutta (2018).
Category I ecosystems are the ones in which any one of the six phenomena
have taken place (A, B, C, D, E or F). Thus, there could be six different types
of affected ecosystems in this category. So, this category has been assigned a score
of 06 (Table 1).
In Category II ecosystems, any two out of the six phenomena have occurred. As
calculated in MS Excel, the six phenomena can occur in 15 different combinations
whenever any two phenomena are grouped together (A + B, A + C, A + D, A + E,
A + F, B + C, B + D, B + E, B + F, C + D, C + E, C + F, D + E, D + F, E + F).
Thus, there could be 15 different types of affected ecosystems in this category. So,
this category has been assigned a score of 15. Similarly, the scores of the categories
III, IV, V and VI have been found to be 20, 15, 06 and 01 respectively (Table 1).
Table 1 Scores obtained by
the six categories of
ecosystems considered
Category of ecosystem
Score
Chi-square test (among
the scores)
I
06
χ 2 = 24.90, df = 5, p <
0.01
II
15
III
20
IV
15
V
06
VI
01