

Plant Diversity and Distribution Pattern in Tropical Dry …
201
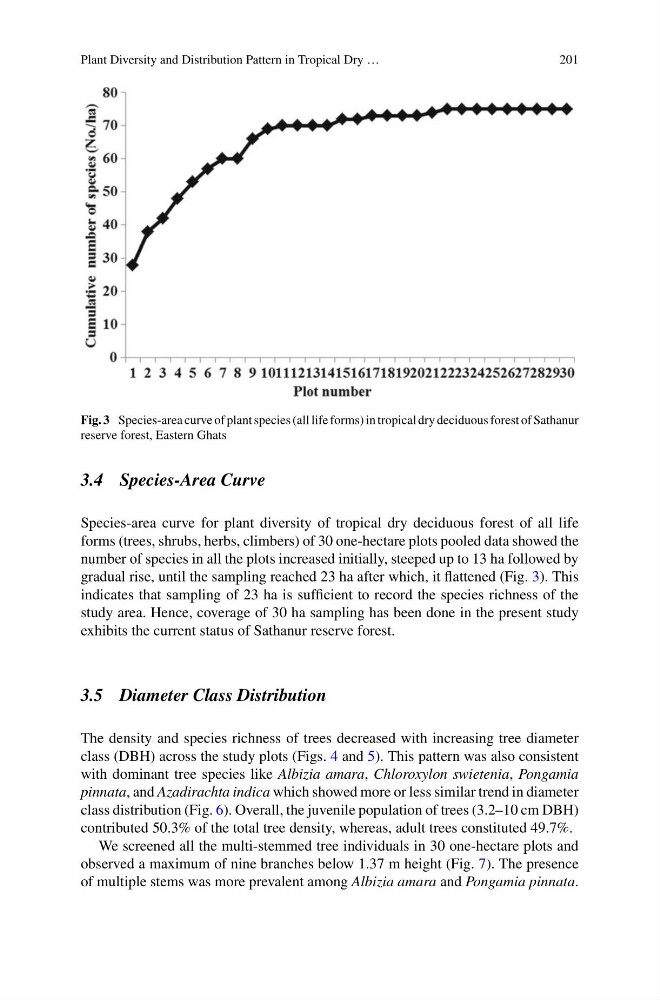
Fig. 3 Species-area curve of plant species (all life forms) in tropical dry deciduous forest of Sathanur
reserve forest, Eastern Ghats
3.4 Species-Area Curve
Species-area curve for plant diversity of tropical dry deciduous forest of all life
forms (trees, shrubs, herbs, climbers) of 30 one-hectare plots pooled data showed the
number of species in all the plots increased initially, steeped up to 13 ha followed by
gradual rise, until the sampling reached 23 ha after which, it flattened (Fig. 3). This
indicates that sampling of 23 ha is sufficient to record the species richness of the
study area. Hence, coverage of 30 ha sampling has been done in the present study
exhibits the current status of Sathanur reserve forest.
3.5 Diameter Class Distribution
The density and species richness of trees decreased with increasing tree diameter
class (DBH) across the study plots (Figs. 4 and 5). This pattern was also consistent
with dominant tree species like Albizia amara, Chloroxylon swietenia, Pongamia
pinnata, and Azadirachta indica which showed more or less similar trend in diameter
class distribution (Fig. 6). Overall, the juvenile population of trees (3.2–10 cm DBH)
contributed 50.3% of the total tree density, whereas, adult trees constituted 49.7%.
We screened all the multi-stemmed tree individuals in 30 one-hectare plots and
observed a maximum of nine branches below 1.37 m height (Fig. 7). The presence
of multiple stems was more prevalent among Albizia amara and Pongamia pinnata.
201
Fig. 3 Species-area curve of plant species (all life forms) in tropical dry deciduous forest of Sathanur
reserve forest, Eastern Ghats
3.4 Species-Area Curve
Species-area curve for plant diversity of tropical dry deciduous forest of all life
forms (trees, shrubs, herbs, climbers) of 30 one-hectare plots pooled data showed the
number of species in all the plots increased initially, steeped up to 13 ha followed by
gradual rise, until the sampling reached 23 ha after which, it flattened (Fig. 3). This
indicates that sampling of 23 ha is sufficient to record the species richness of the
study area. Hence, coverage of 30 ha sampling has been done in the present study
exhibits the current status of Sathanur reserve forest.
3.5 Diameter Class Distribution
The density and species richness of trees decreased with increasing tree diameter
class (DBH) across the study plots (Figs. 4 and 5). This pattern was also consistent
with dominant tree species like Albizia amara, Chloroxylon swietenia, Pongamia
pinnata, and Azadirachta indica which showed more or less similar trend in diameter
class distribution (Fig. 6). Overall, the juvenile population of trees (3.2–10 cm DBH)
contributed 50.3% of the total tree density, whereas, adult trees constituted 49.7%.
We screened all the multi-stemmed tree individuals in 30 one-hectare plots and
observed a maximum of nine branches below 1.37 m height (Fig. 7). The presence
of multiple stems was more prevalent among Albizia amara and Pongamia pinnata.