

149
4 A Comparative Response of Glaciers in Arctic
and Himalaya During 2000–2015 Period
In Fig. 5, variable responses of annual mass balance of glaciers of Svalbard, Arctic,
and Chandra basin, Himalaya has been shown. Though the magnitude of the mass
balance data is highly variable and incomparable, yet these provide clear information of overall annual mass loss in both the regions. Analyses of data indicate that
glaciers of Svalbard have been experiencing continuous negative annual mass
balance during observation period (2000–2015) while glaciers of Chandra basin in
Himalaya have significant years of positive annual mass balance during observation
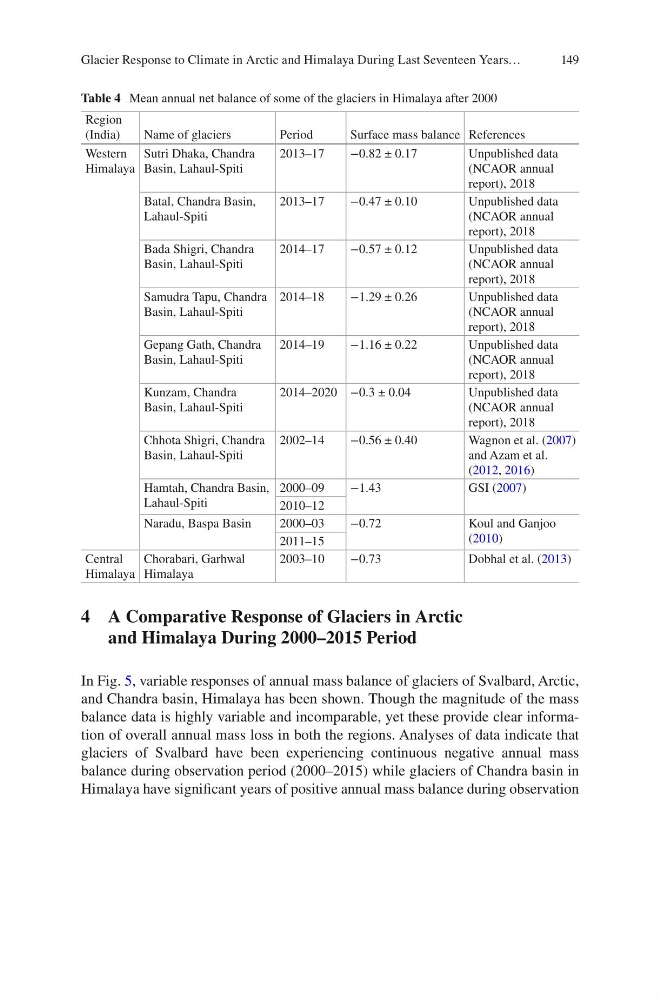
Table 4 Mean annual net balance of some of the glaciers in Himalaya after 2000
Region
(India)
Name of glaciers
Period
Surface mass balance References
Western
Himalaya
Sutri Dhaka, Chandra
Basin, Lahaul-Spiti
2013–17
−0.82 ± 0.17
Unpublished data
(NCAOR annual
report), 2018
Batal, Chandra Basin,
Lahaul-Spiti
2013–17
−0.47 ± 0.10
Unpublished data
(NCAOR annual
report), 2018
Bada Shigri, Chandra
Basin, Lahaul-Spiti
2014–17
−0.57 ± 0.12
Unpublished data
(NCAOR annual
report), 2018
Samudra Tapu, Chandra
Basin, Lahaul-Spiti
2014–18
−1.29 ± 0.26
Unpublished data
(NCAOR annual
report), 2018
Gepang Gath, Chandra
Basin, Lahaul-Spiti
2014–19
−1.16 ± 0.22
Unpublished data
(NCAOR annual
report), 2018
Kunzam, Chandra
Basin, Lahaul-Spiti
2014–2020 −0.3 ± 0.04
Unpublished data
(NCAOR annual
report), 2018
Chhota Shigri, Chandra
Basin, Lahaul-Spiti
2002–14
−0.56 ± 0.40
Wagnon et al. (2007)
and Azam et al.
(2012, 2016)
Hamtah, Chandra Basin,
Lahaul-Spiti
2000–09
−1.43
GSI (2007)
2010–12
Naradu, Baspa Basin
2000–03
−0.72
Koul and Ganjoo
(2010)
2011–15
Central
Himalaya
Chorabari, Garhwal
Himalaya
2003–10
−0.73
Dobhal et al. (2013)
Glacier Response to Climate in Arctic and Himalaya During Last Seventeen Years…
4 A Comparative Response of Glaciers in Arctic
and Himalaya During 2000–2015 Period
In Fig. 5, variable responses of annual mass balance of glaciers of Svalbard, Arctic,
and Chandra basin, Himalaya has been shown. Though the magnitude of the mass
balance data is highly variable and incomparable, yet these provide clear information of overall annual mass loss in both the regions. Analyses of data indicate that
glaciers of Svalbard have been experiencing continuous negative annual mass
balance during observation period (2000–2015) while glaciers of Chandra basin in
Himalaya have significant years of positive annual mass balance during observation
Table 4 Mean annual net balance of some of the glaciers in Himalaya after 2000
Region
(India)
Name of glaciers
Period
Surface mass balance References
Western
Himalaya
Sutri Dhaka, Chandra
Basin, Lahaul-Spiti
2013–17
−0.82 ± 0.17
Unpublished data
(NCAOR annual
report), 2018
Batal, Chandra Basin,
Lahaul-Spiti
2013–17
−0.47 ± 0.10
Unpublished data
(NCAOR annual
report), 2018
Bada Shigri, Chandra
Basin, Lahaul-Spiti
2014–17
−0.57 ± 0.12
Unpublished data
(NCAOR annual
report), 2018
Samudra Tapu, Chandra
Basin, Lahaul-Spiti
2014–18
−1.29 ± 0.26
Unpublished data
(NCAOR annual
report), 2018
Gepang Gath, Chandra
Basin, Lahaul-Spiti
2014–19
−1.16 ± 0.22
Unpublished data
(NCAOR annual
report), 2018
Kunzam, Chandra
Basin, Lahaul-Spiti
2014–2020 −0.3 ± 0.04
Unpublished data
(NCAOR annual
report), 2018
Chhota Shigri, Chandra
Basin, Lahaul-Spiti
2002–14
−0.56 ± 0.40
Wagnon et al. (2007)
and Azam et al.
(2012, 2016)
Hamtah, Chandra Basin,
Lahaul-Spiti
2000–09
−1.43
GSI (2007)
2010–12
Naradu, Baspa Basin
2000–03
−0.72
Koul and Ganjoo
(2010)
2011–15
Central
Himalaya
Chorabari, Garhwal
Himalaya
2003–10
−0.73
Dobhal et al. (2013)
Glacier Response to Climate in Arctic and Himalaya During Last Seventeen Years…