

126
E
c v
r = ( )
/
2
(1)
where, E r is the relative dielectric constant of the subsurface medium, c is the velocity of light (0.3 m ns
−1
) and v is the velocity of the layer underneath.
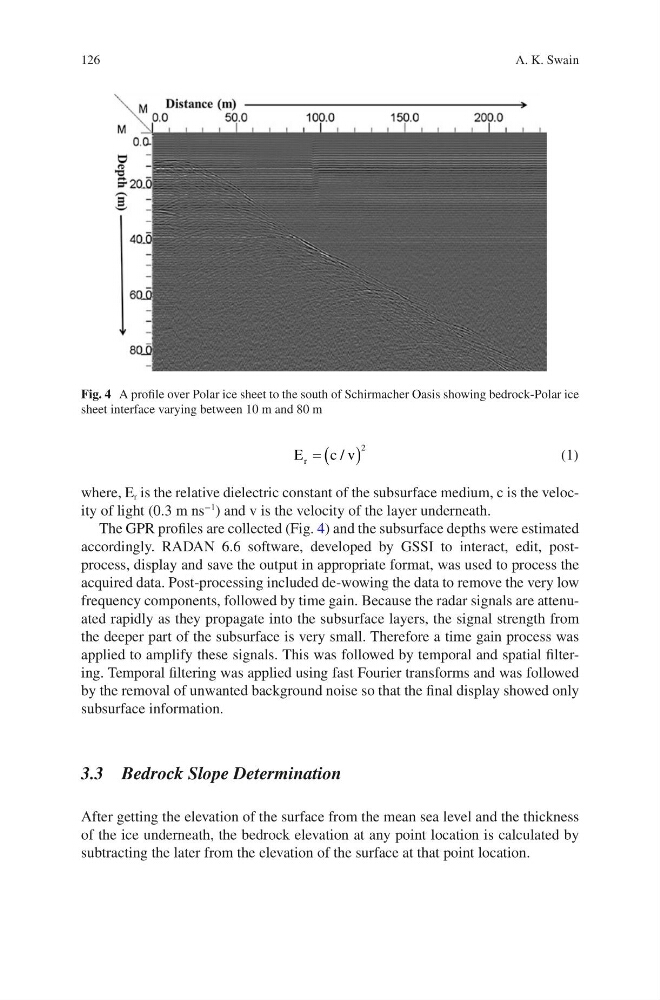
The GPR profiles are collected (Fig. 4) and the subsurface depths were estimated
accordingly. RADAN 6.6 software, developed by GSSI to interact, edit, postprocess, display and save the output in appropriate format, was used to process the
acquired data. Post-processing included de-wowing the data to remove the very low
frequency components, followed by time gain. Because the radar signals are attenuated rapidly as they propagate into the subsurface layers, the signal strength from
the deeper part of the subsurface is very small. Therefore a time gain process was
applied to amplify these signals. This was followed by temporal and spatial filtering. Temporal filtering was applied using fast Fourier transforms and was followed
by the removal of unwanted background noise so that the final display showed only
subsurface information.
3.3 Bedrock Slope Determination
After getting the elevation of the surface from the mean sea level and the thickness
of the ice underneath, the bedrock elevation at any point location is calculated by
subtracting the later from the elevation of the surface at that point location.
Fig. 4 A profile over Polar ice sheet to the south of Schirmacher Oasis showing bedrock-Polar ice
sheet interface varying between 10 m and 80 m
A. K. Swain
E
c v
r = ( )
/
2
(1)
where, E r is the relative dielectric constant of the subsurface medium, c is the velocity of light (0.3 m ns
−1
) and v is the velocity of the layer underneath.
The GPR profiles are collected (Fig. 4) and the subsurface depths were estimated
accordingly. RADAN 6.6 software, developed by GSSI to interact, edit, postprocess, display and save the output in appropriate format, was used to process the
acquired data. Post-processing included de-wowing the data to remove the very low
frequency components, followed by time gain. Because the radar signals are attenuated rapidly as they propagate into the subsurface layers, the signal strength from
the deeper part of the subsurface is very small. Therefore a time gain process was
applied to amplify these signals. This was followed by temporal and spatial filtering. Temporal filtering was applied using fast Fourier transforms and was followed
by the removal of unwanted background noise so that the final display showed only
subsurface information.
3.3 Bedrock Slope Determination
After getting the elevation of the surface from the mean sea level and the thickness
of the ice underneath, the bedrock elevation at any point location is calculated by
subtracting the later from the elevation of the surface at that point location.
Fig. 4 A profile over Polar ice sheet to the south of Schirmacher Oasis showing bedrock-Polar ice
sheet interface varying between 10 m and 80 m
A. K. Swain