

14.2 Background
Tensile coupons were manufactured from four symmetric plies of a glass fiber reinforced polymer composite (GFRP) prepreg
in orientations of 0
and Æ45
. Each coupon had G-10 fiberglass tabs adhered to each end with Hysol 9394. The specimens
had gauge lengths of approximately 110 mm (4.5 in.) and were 19.1 mm (0.75 in.) wide. Initial tests were run to determine
what the glass transition temperature of each coupon was. Each specimen was brought to a high temperature (either 180 or
210
C) and held there for 30 min to erase the thermal history in the specimen. At that point the specimen was cycled at 1 Hz as
the temperature was dropped at a rate of 0.5
C/min. The coupons were cycled under load control from 11 lbf to 33 lbf. After
one cool down cycle they were reheated to the high temperature at 0.5
C/min, held for 30 min and then cooled again to check
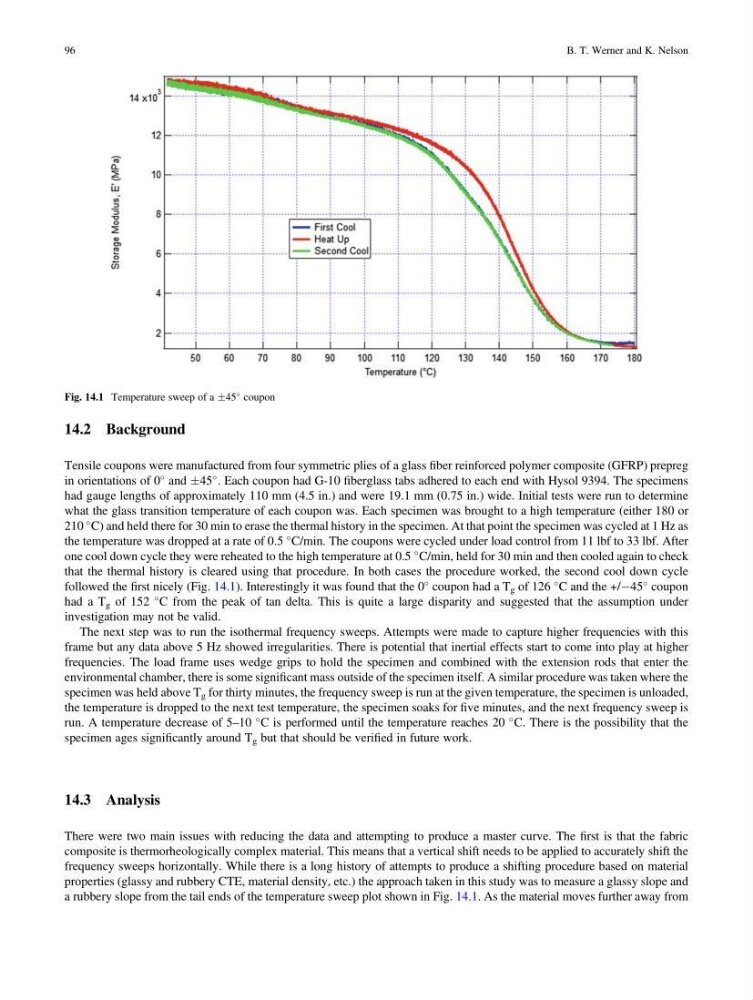
that the thermal history is cleared using that procedure. In both cases the procedure worked, the second cool down cycle
followed the first nicely (Fig. 14.1). Interestingly it was found that the 0
coupon had a T g of 126
C and the +/À45
coupon
had a T g of 152
C from the peak of tan delta. This is quite a large disparity and suggested that the assumption under
investigation may not be valid.
The next step was to run the isothermal frequency sweeps. Attempts were made to capture higher frequencies with this
frame but any data above 5 Hz showed irregularities. There is potential that inertial effects start to come into play at higher
frequencies. The load frame uses wedge grips to hold the specimen and combined with the extension rods that enter the
environmental chamber, there is some significant mass outside of the specimen itself. A similar procedure was taken where the
specimen was held above T g for thirty minutes, the frequency sweep is run at the given temperature, the specimen is unloaded,
the temperature is dropped to the next test temperature, the specimen soaks for five minutes, and the next frequency sweep is
run. A temperature decrease of 5–10
C is performed until the temperature reaches 20
C. There is the possibility that the
specimen ages significantly around T g but that should be verified in future work.
14.3 Analysis
There were two main issues with reducing the data and attempting to produce a master curve. The first is that the fabric
composite is thermorheologically complex material. This means that a vertical shift needs to be applied to accurately shift the
frequency sweeps horizontally. While there is a long history of attempts to produce a shifting procedure based on material
properties (glassy and rubbery CTE, material density, etc.) the approach taken in this study was to measure a glassy slope and
a rubbery slope from the tail ends of the temperature sweep plot shown in Fig. 14.1. As the material moves further away from
Fig. 14.1 Temperature sweep of a Æ45
coupon
96
B. T. Werner and K. Nelson
Tensile coupons were manufactured from four symmetric plies of a glass fiber reinforced polymer composite (GFRP) prepreg
in orientations of 0
and Æ45
. Each coupon had G-10 fiberglass tabs adhered to each end with Hysol 9394. The specimens
had gauge lengths of approximately 110 mm (4.5 in.) and were 19.1 mm (0.75 in.) wide. Initial tests were run to determine
what the glass transition temperature of each coupon was. Each specimen was brought to a high temperature (either 180 or
210
C) and held there for 30 min to erase the thermal history in the specimen. At that point the specimen was cycled at 1 Hz as
the temperature was dropped at a rate of 0.5
C/min. The coupons were cycled under load control from 11 lbf to 33 lbf. After
one cool down cycle they were reheated to the high temperature at 0.5
C/min, held for 30 min and then cooled again to check
that the thermal history is cleared using that procedure. In both cases the procedure worked, the second cool down cycle
followed the first nicely (Fig. 14.1). Interestingly it was found that the 0
coupon had a T g of 126
C and the +/À45
coupon
had a T g of 152
C from the peak of tan delta. This is quite a large disparity and suggested that the assumption under
investigation may not be valid.
The next step was to run the isothermal frequency sweeps. Attempts were made to capture higher frequencies with this
frame but any data above 5 Hz showed irregularities. There is potential that inertial effects start to come into play at higher
frequencies. The load frame uses wedge grips to hold the specimen and combined with the extension rods that enter the
environmental chamber, there is some significant mass outside of the specimen itself. A similar procedure was taken where the
specimen was held above T g for thirty minutes, the frequency sweep is run at the given temperature, the specimen is unloaded,
the temperature is dropped to the next test temperature, the specimen soaks for five minutes, and the next frequency sweep is
run. A temperature decrease of 5–10
C is performed until the temperature reaches 20
C. There is the possibility that the
specimen ages significantly around T g but that should be verified in future work.
14.3 Analysis
There were two main issues with reducing the data and attempting to produce a master curve. The first is that the fabric
composite is thermorheologically complex material. This means that a vertical shift needs to be applied to accurately shift the
frequency sweeps horizontally. While there is a long history of attempts to produce a shifting procedure based on material
properties (glassy and rubbery CTE, material density, etc.) the approach taken in this study was to measure a glassy slope and
a rubbery slope from the tail ends of the temperature sweep plot shown in Fig. 14.1. As the material moves further away from
Fig. 14.1 Temperature sweep of a Æ45
coupon
96
B. T. Werner and K. Nelson