

2.4 Test Results and Discussions
41
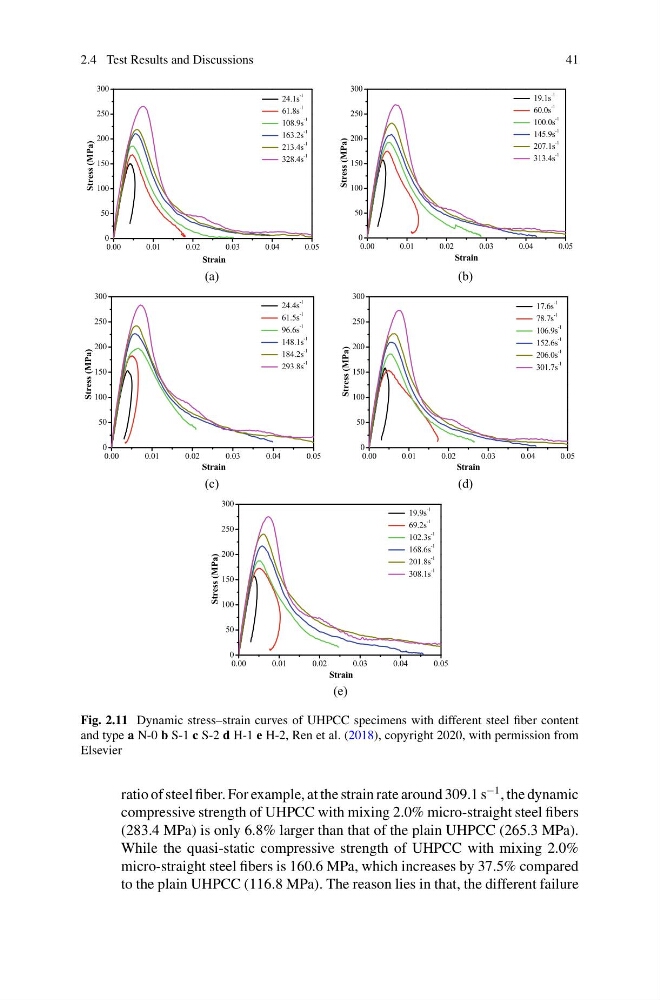
Fig. 2.11 Dynamic stress–strain curves of UHPCC specimens with different steel fiber content
and type a N-0 b S-1 c S-2 d H-1 e H-2, Ren et al. (2018), copyright 2020, with permission from
Elsevier
ratio of steel fiber. For example, at the strain rate around 309.1 s
−1 , the dynamic
compressive strength of UHPCC with mixing 2.0% micro-straight steel fibers
(283.4 MPa) is only 6.8% larger than that of the plain UHPCC (265.3 MPa).
While the quasi-static compressive strength of UHPCC with mixing 2.0%
micro-straight steel fibers is 160.6 MPa, which increases by 37.5% compared
to the plain UHPCC (116.8 MPa). The reason lies in that, the different failure
41
Fig. 2.11 Dynamic stress–strain curves of UHPCC specimens with different steel fiber content
and type a N-0 b S-1 c S-2 d H-1 e H-2, Ren et al. (2018), copyright 2020, with permission from
Elsevier
ratio of steel fiber. For example, at the strain rate around 309.1 s
−1 , the dynamic
compressive strength of UHPCC with mixing 2.0% micro-straight steel fibers
(283.4 MPa) is only 6.8% larger than that of the plain UHPCC (265.3 MPa).
While the quasi-static compressive strength of UHPCC with mixing 2.0%
micro-straight steel fibers is 160.6 MPa, which increases by 37.5% compared
to the plain UHPCC (116.8 MPa). The reason lies in that, the different failure