

13.4 Numerical Simulation
461
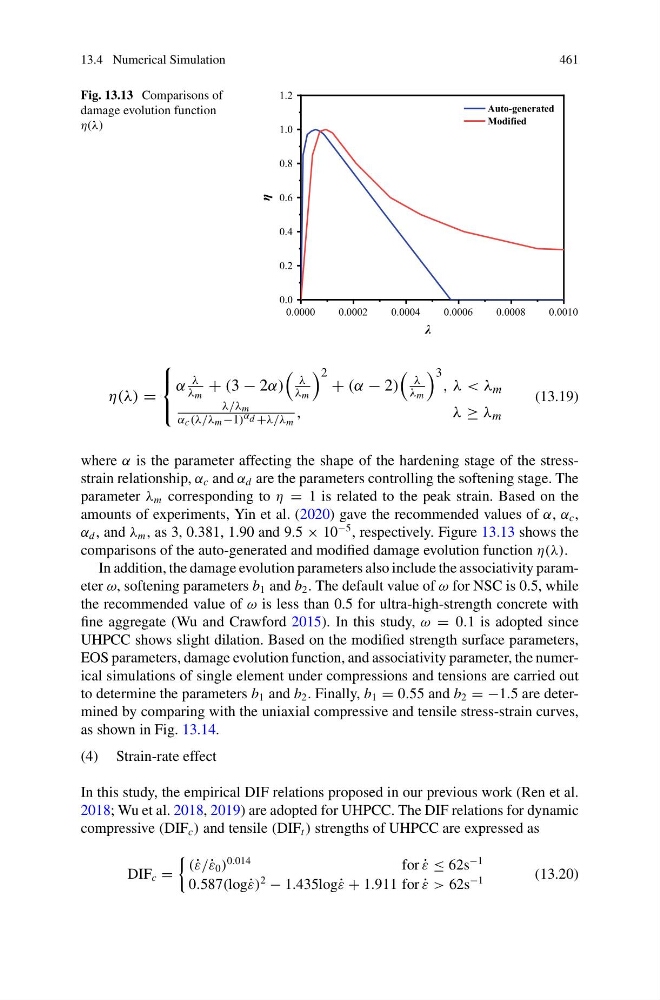
Fig. 13.13 Comparisons of
damage evolution function
η(λ)
0.0000
0.0002
0.0004
0.0006
0.0008
0.0010
0.0
0.2
0.4
0.6
0.8
1.0
1.2
η
λ
Auto-generated
Modified
η(λ) =
⎧
⎨
⎩
α
λ
λ m
+ (3 − 2α)
λ
λ m
2 + (α − 2)
λ
λ m
3 , λ < λ m
λ/λ m
α c (λ/λ m −1) α d +λ/λ m
,
λ ≥ λ m
(13.19)
where α is the parameter affecting the shape of the hardening stage of the stressstrain relationship, α c and α d are the parameters controlling the softening stage. The
parameter λ m corresponding to η = 1 is related to the peak strain. Based on the
amounts of experiments, Yin et al. (2020) gave the recommended values of α, α c ,
α d , and λ m , as 3, 0.381, 1.90 and 9.5 × 10
−5 , respectively. Figure 13.13 shows the
comparisons of the auto-generated and modified damage evolution function η(λ).
In addition, the damage evolution parameters also include the associativity parameter ω, softening parameters b 1 and b 2 . The default value of ω for NSC is 0.5, while
the recommended value of ω is less than 0.5 for ultra-high-strength concrete with
fine aggregate (Wu and Crawford 2015). In this study, ω = 0.1 is adopted since
UHPCC shows slight dilation. Based on the modified strength surface parameters,
EOS parameters, damage evolution function, and associativity parameter, the numerical simulations of single element under compressions and tensions are carried out
to determine the parameters b 1 and b 2 . Finally, b 1 = 0.55 and b 2 = −1.5 are determined by comparing with the uniaxial compressive and tensile stress-strain curves,
as shown in Fig. 13.14.
(4) Strain-rate effect
In this study, the empirical DIF relations proposed in our previous work (Ren et al.
2018; Wu et al. 2018, 2019) are adopted for UHPCC. The DIF relations for dynamic
compressive (DIF c ) and tensile (DIF t ) strengths of UHPCC are expressed as
DIF c =
(˙ ε/˙ ε 0 )
0.014
for ˙
ε ≤ 62s
−1
0.587(log˙ ε)
2
− 1.435log˙ ε + 1.911 for ˙
ε > 62s
−1
(13.20)
461
Fig. 13.13 Comparisons of
damage evolution function
η(λ)
0.0000
0.0002
0.0004
0.0006
0.0008
0.0010
0.0
0.2
0.4
0.6
0.8
1.0
1.2
η
λ
Auto-generated
Modified
η(λ) =
⎧
⎨
⎩
α
λ
λ m
+ (3 − 2α)
λ
λ m
2 + (α − 2)
λ
λ m
3 , λ < λ m
λ/λ m
α c (λ/λ m −1) α d +λ/λ m
,
λ ≥ λ m
(13.19)
where α is the parameter affecting the shape of the hardening stage of the stressstrain relationship, α c and α d are the parameters controlling the softening stage. The
parameter λ m corresponding to η = 1 is related to the peak strain. Based on the
amounts of experiments, Yin et al. (2020) gave the recommended values of α, α c ,
α d , and λ m , as 3, 0.381, 1.90 and 9.5 × 10
−5 , respectively. Figure 13.13 shows the
comparisons of the auto-generated and modified damage evolution function η(λ).
In addition, the damage evolution parameters also include the associativity parameter ω, softening parameters b 1 and b 2 . The default value of ω for NSC is 0.5, while
the recommended value of ω is less than 0.5 for ultra-high-strength concrete with
fine aggregate (Wu and Crawford 2015). In this study, ω = 0.1 is adopted since
UHPCC shows slight dilation. Based on the modified strength surface parameters,
EOS parameters, damage evolution function, and associativity parameter, the numerical simulations of single element under compressions and tensions are carried out
to determine the parameters b 1 and b 2 . Finally, b 1 = 0.55 and b 2 = −1.5 are determined by comparing with the uniaxial compressive and tensile stress-strain curves,
as shown in Fig. 13.14.
(4) Strain-rate effect
In this study, the empirical DIF relations proposed in our previous work (Ren et al.
2018; Wu et al. 2018, 2019) are adopted for UHPCC. The DIF relations for dynamic
compressive (DIF c ) and tensile (DIF t ) strengths of UHPCC are expressed as
DIF c =
(˙ ε/˙ ε 0 )
0.014
for ˙
ε ≤ 62s
−1
0.587(log˙ ε)
2
− 1.435log˙ ε + 1.911 for ˙
ε > 62s
−1
(13.20)