

442
13 Experimental and Numerical Studies on Dynamic Behavior …
0.0 0.2 0.4 0.6 0.8 1.0 1.2 1.4 1.6 1.8 2.0
-1
0
1
2
3
4
5
6
Reflected overpressure (MPa)
Time (ms)
P r1
P r2
P r3
0.0 0.2 0.4 0.6 0.8 1.0 1.2 1.4 1.6 1.8 2.0
-1
0
1
2
3
4
5
6
7
Reflected overpressure (MPa)
Time (ms)
P r1
P r2
P r3
(a)
(b)
0.0 0.2 0.4 0.6 0.8 1.0 1.2 1.4 1.6 1.8 2.0
-5
0
5
10
15
20
25
Reflected overpressure (MPa)
Time (ms)
P r1
P r2
P r3
0.0 0.2 0.4 0.6 0.8 1.0 1.2 1.4 1.6 1.8 2.0
-5
0
5
10
15
20
25
30
35
40
Reflected overpressure (MPa)
Time (ms)
P r1
P r2
P r3
(c)
(d)
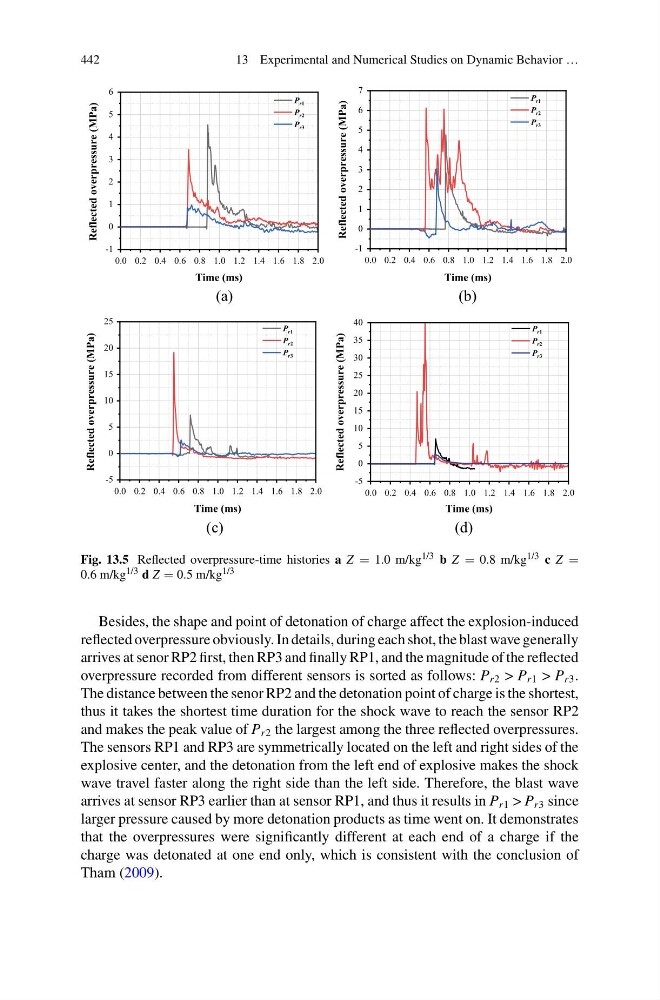
Fig. 13.5 Reflected overpressure-time histories a Z = 1.0 m/kg 1/3 b Z = 0.8 m/kg 1/3 c Z =
0.6 m/kg 1/3 d Z = 0.5 m/kg 1/3
Besides, the shape and point of detonation of charge affect the explosion-induced
reflected overpressure obviously. In details, during each shot, the blast wave generally
arrives at senor RP2 first, then RP3 and finally RP1, and the magnitude of the reflected
overpressure recorded from different sensors is sorted as follows: P r2 > P r1 > P r3 .
The distance between the senor RP2 and the detonation point of charge is the shortest,
thus it takes the shortest time duration for the shock wave to reach the sensor RP2
and makes the peak value of P r2 the largest among the three reflected overpressures.
The sensors RP1 and RP3 are symmetrically located on the left and right sides of the
explosive center, and the detonation from the left end of explosive makes the shock
wave travel faster along the right side than the left side. Therefore, the blast wave
arrives at sensor RP3 earlier than at sensor RP1, and thus it results in P r1 > P r3 since
larger pressure caused by more detonation products as time went on. It demonstrates
that the overpressures were significantly different at each end of a charge if the
charge was detonated at one end only, which is consistent with the conclusion of
Tham (2009).
13 Experimental and Numerical Studies on Dynamic Behavior …
0.0 0.2 0.4 0.6 0.8 1.0 1.2 1.4 1.6 1.8 2.0
-1
0
1
2
3
4
5
6
Reflected overpressure (MPa)
Time (ms)
P r1
P r2
P r3
0.0 0.2 0.4 0.6 0.8 1.0 1.2 1.4 1.6 1.8 2.0
-1
0
1
2
3
4
5
6
7
Reflected overpressure (MPa)
Time (ms)
P r1
P r2
P r3
(a)
(b)
0.0 0.2 0.4 0.6 0.8 1.0 1.2 1.4 1.6 1.8 2.0
-5
0
5
10
15
20
25
Reflected overpressure (MPa)
Time (ms)
P r1
P r2
P r3
0.0 0.2 0.4 0.6 0.8 1.0 1.2 1.4 1.6 1.8 2.0
-5
0
5
10
15
20
25
30
35
40
Reflected overpressure (MPa)
Time (ms)
P r1
P r2
P r3
(c)
(d)
Fig. 13.5 Reflected overpressure-time histories a Z = 1.0 m/kg 1/3 b Z = 0.8 m/kg 1/3 c Z =
0.6 m/kg 1/3 d Z = 0.5 m/kg 1/3
Besides, the shape and point of detonation of charge affect the explosion-induced
reflected overpressure obviously. In details, during each shot, the blast wave generally
arrives at senor RP2 first, then RP3 and finally RP1, and the magnitude of the reflected
overpressure recorded from different sensors is sorted as follows: P r2 > P r1 > P r3 .
The distance between the senor RP2 and the detonation point of charge is the shortest,
thus it takes the shortest time duration for the shock wave to reach the sensor RP2
and makes the peak value of P r2 the largest among the three reflected overpressures.
The sensors RP1 and RP3 are symmetrically located on the left and right sides of the
explosive center, and the detonation from the left end of explosive makes the shock
wave travel faster along the right side than the left side. Therefore, the blast wave
arrives at sensor RP3 earlier than at sensor RP1, and thus it results in P r1 > P r3 since
larger pressure caused by more detonation products as time went on. It demonstrates
that the overpressures were significantly different at each end of a charge if the
charge was detonated at one end only, which is consistent with the conclusion of
Tham (2009).