

440
13 Experimental and Numerical Studies on Dynamic Behavior …
0
2
4
6
8 10 12 14 16 18 20
-0.04
-0.02
0.00
0.02
0.04
0.06
0.08
Incident overpressure (MPa)
Time (ms)
P i1 -test 1
P i1 -test 2
P i1 -test 3
P i1 -test 4
P i1 -test 5
P i1 -test 6
P i1 -CONWEP
0
2
4
6
8 10 12 14 16 18 20
-0.04
-0.02
0.00
0.02
0.04
0.06
0.08
Incident overpressure (MPa)
Time (ms)
P i2 -test 1
P i2 -test 2
P i2 -test 3
P i2 -CONWEP
(a)
(b)
0
5
10
15
20
25
30
-0.04
-0.02
0.00
0.02
0.04
Incident overpressure (MPa)
Time (ms)
P i3 -test
P i3 -CONWEP
(c)
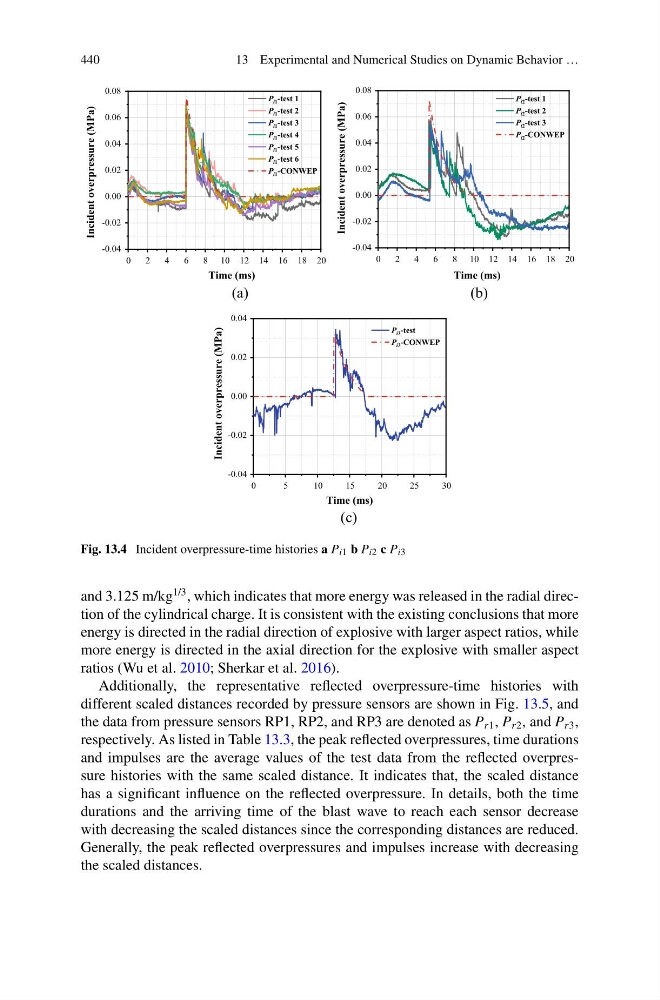
Fig. 13.4 Incident overpressure-time histories a P i1 b P i2 c P i3
and 3.125 m/kg
1/3 , which indicates that more energy was released in the radial direction of the cylindrical charge. It is consistent with the existing conclusions that more
energy is directed in the radial direction of explosive with larger aspect ratios, while
more energy is directed in the axial direction for the explosive with smaller aspect
ratios (Wu et al. 2010; Sherkar et al. 2016).
Additionally, the representative reflected overpressure-time histories with
different scaled distances recorded by pressure sensors are shown in Fig. 13.5, and
the data from pressure sensors RP1, RP2, and RP3 are denoted as P r1 , P r2 , and P r3 ,
respectively. As listed in Table 13.3, the peak reflected overpressures, time durations
and impulses are the average values of the test data from the reflected overpressure histories with the same scaled distance. It indicates that, the scaled distance
has a significant influence on the reflected overpressure. In details, both the time
durations and the arriving time of the blast wave to reach each sensor decrease
with decreasing the scaled distances since the corresponding distances are reduced.
Generally, the peak reflected overpressures and impulses increase with decreasing
the scaled distances.
13 Experimental and Numerical Studies on Dynamic Behavior …
0
2
4
6
8 10 12 14 16 18 20
-0.04
-0.02
0.00
0.02
0.04
0.06
0.08
Incident overpressure (MPa)
Time (ms)
P i1 -test 1
P i1 -test 2
P i1 -test 3
P i1 -test 4
P i1 -test 5
P i1 -test 6
P i1 -CONWEP
0
2
4
6
8 10 12 14 16 18 20
-0.04
-0.02
0.00
0.02
0.04
0.06
0.08
Incident overpressure (MPa)
Time (ms)
P i2 -test 1
P i2 -test 2
P i2 -test 3
P i2 -CONWEP
(a)
(b)
0
5
10
15
20
25
30
-0.04
-0.02
0.00
0.02
0.04
Incident overpressure (MPa)
Time (ms)
P i3 -test
P i3 -CONWEP
(c)
Fig. 13.4 Incident overpressure-time histories a P i1 b P i2 c P i3
and 3.125 m/kg
1/3 , which indicates that more energy was released in the radial direction of the cylindrical charge. It is consistent with the existing conclusions that more
energy is directed in the radial direction of explosive with larger aspect ratios, while
more energy is directed in the axial direction for the explosive with smaller aspect
ratios (Wu et al. 2010; Sherkar et al. 2016).
Additionally, the representative reflected overpressure-time histories with
different scaled distances recorded by pressure sensors are shown in Fig. 13.5, and
the data from pressure sensors RP1, RP2, and RP3 are denoted as P r1 , P r2 , and P r3 ,
respectively. As listed in Table 13.3, the peak reflected overpressures, time durations
and impulses are the average values of the test data from the reflected overpressure histories with the same scaled distance. It indicates that, the scaled distance
has a significant influence on the reflected overpressure. In details, both the time
durations and the arriving time of the blast wave to reach each sensor decrease
with decreasing the scaled distances since the corresponding distances are reduced.
Generally, the peak reflected overpressures and impulses increase with decreasing
the scaled distances.