

438
13 Experimental and Numerical Studies on Dynamic Behavior …
Systematic test data are designed to be measured, and the plane view of sensors
arrangement is schematically shown in Fig. 13.2c. To obtain the blast overpressuretime histories, three incident pressure sensors (IP1, IP2, and IP3) and three reflected
pressure sensors (RP1, RP2, and RP3) were arranged with the identical horizontal
plane with the TNT charge center. The horizontal distances between the incident
pressure sensors and panels were fixed in each shot, in which IP1, IP2, and IP3 were
located at a horizontal distance of 4.85 m, 4.96 m, and 7.75 m from the panel center,
respectively. Thus the identical incident pressure-time histories can be recorded in
each shot ideally. As for the reflected pressure sensors, to avoid the breakdown of test
devices during the blast, the reflected pressure sensors were installed on the frame
aside the panel instead of on the surface of the panel. Three reflected overpressure
sensors were placed at the same height and the relative position is unchanged (with
a spacing of 500 mm) in each shot. However, the relative positions from reflected
pressure sensors to the panel center varied with the different scaled distances. That
is to say, in each shot, both the vertical and horizontal distances between reflected
pressure sensor RP2 and panel center are equal to the standoff distances R, as shown
in Fig. 13.2a, c, which guarantees that the distances from sensor PR2 to the charge
center were consistent with the distance from the front face center of panels to the
charge center. Therefore, the overpressure obtained from PR2 can be considered as
the reflected overpressure of the front face center of panels. Accordingly, the reflected
overpressures of RP1 and RP3 can be considered as the reflected overpressures of
points D2 and D3 on the front face of panels, respectively. Besides, the displacement
sensors (D1-D4) and acceleration sensors (A1-A3) were arranged at the bottom of
the panel inside the testing box, as shown in Fig. 13.2d with the locations illustrated in Fig. 13.2c. During each shot, the locations of pressure sensors were firstly
adjusted according to the scaled distances, then the inner displacement and acceleration sensors were installed. After the signals were checked, the sandbags were
stacked at the entrance of the testing box to make sure that blast waves would not
arrive at the bottom face of panels.
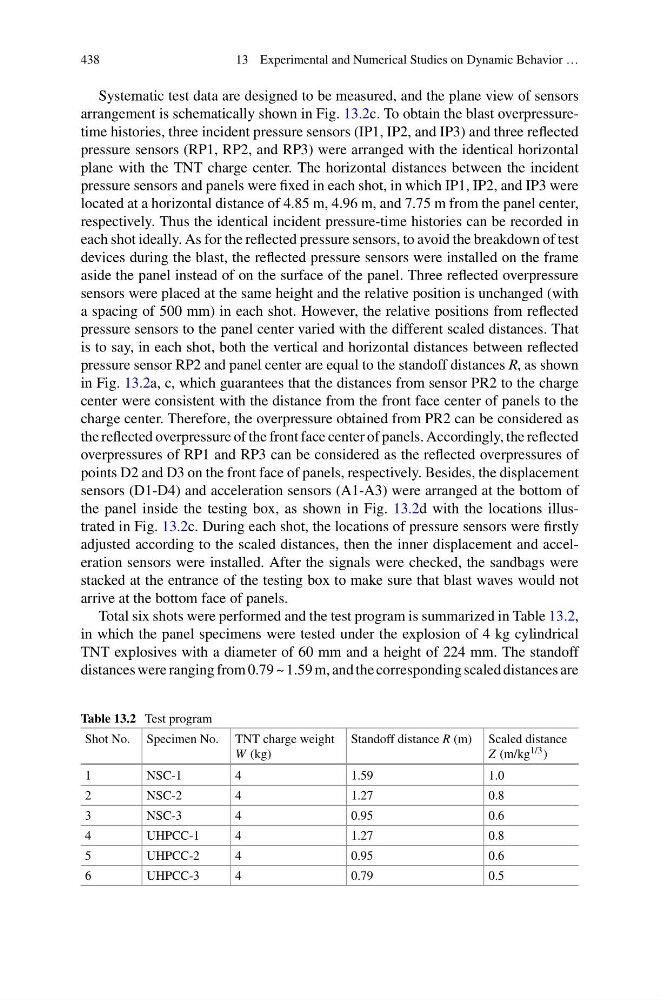
Total six shots were performed and the test program is summarized in Table 13.2,
in which the panel specimens were tested under the explosion of 4 kg cylindrical
TNT explosives with a diameter of 60 mm and a height of 224 mm. The standoff
distances were ranging from 0.79 ~ 1.59 m, and the corresponding scaled distances are
Table 13.2 Test program
Shot No. Specimen No. TNT charge weight
W (kg)
Standoff distance R (m) Scaled distance
Z (m/kg 1/3 )
1
NSC-1
4
1.59
1.0
2
NSC-2
4
1.27
0.8
3
NSC-3
4
0.95
0.6
4
UHPCC-1
4
1.27
0.8
5
UHPCC-2
4
0.95
0.6
6
UHPCC-3
4
0.79
0.5
13 Experimental and Numerical Studies on Dynamic Behavior …
Systematic test data are designed to be measured, and the plane view of sensors
arrangement is schematically shown in Fig. 13.2c. To obtain the blast overpressuretime histories, three incident pressure sensors (IP1, IP2, and IP3) and three reflected
pressure sensors (RP1, RP2, and RP3) were arranged with the identical horizontal
plane with the TNT charge center. The horizontal distances between the incident
pressure sensors and panels were fixed in each shot, in which IP1, IP2, and IP3 were
located at a horizontal distance of 4.85 m, 4.96 m, and 7.75 m from the panel center,
respectively. Thus the identical incident pressure-time histories can be recorded in
each shot ideally. As for the reflected pressure sensors, to avoid the breakdown of test
devices during the blast, the reflected pressure sensors were installed on the frame
aside the panel instead of on the surface of the panel. Three reflected overpressure
sensors were placed at the same height and the relative position is unchanged (with
a spacing of 500 mm) in each shot. However, the relative positions from reflected
pressure sensors to the panel center varied with the different scaled distances. That
is to say, in each shot, both the vertical and horizontal distances between reflected
pressure sensor RP2 and panel center are equal to the standoff distances R, as shown
in Fig. 13.2a, c, which guarantees that the distances from sensor PR2 to the charge
center were consistent with the distance from the front face center of panels to the
charge center. Therefore, the overpressure obtained from PR2 can be considered as
the reflected overpressure of the front face center of panels. Accordingly, the reflected
overpressures of RP1 and RP3 can be considered as the reflected overpressures of
points D2 and D3 on the front face of panels, respectively. Besides, the displacement
sensors (D1-D4) and acceleration sensors (A1-A3) were arranged at the bottom of
the panel inside the testing box, as shown in Fig. 13.2d with the locations illustrated in Fig. 13.2c. During each shot, the locations of pressure sensors were firstly
adjusted according to the scaled distances, then the inner displacement and acceleration sensors were installed. After the signals were checked, the sandbags were
stacked at the entrance of the testing box to make sure that blast waves would not
arrive at the bottom face of panels.
Total six shots were performed and the test program is summarized in Table 13.2,
in which the panel specimens were tested under the explosion of 4 kg cylindrical
TNT explosives with a diameter of 60 mm and a height of 224 mm. The standoff
distances were ranging from 0.79 ~ 1.59 m, and the corresponding scaled distances are
Table 13.2 Test program
Shot No. Specimen No. TNT charge weight
W (kg)
Standoff distance R (m) Scaled distance
Z (m/kg 1/3 )
1
NSC-1
4
1.59
1.0
2
NSC-2
4
1.27
0.8
3
NSC-3
4
0.95
0.6
4
UHPCC-1
4
1.27
0.8
5
UHPCC-2
4
0.95
0.6
6
UHPCC-3
4
0.79
0.5