

12.4 Low-Frequency Cyclic Loading Test
415
residual seismic response of the column. It should be noticed that the number of
cycles for C-13 specimen was more than that of C-12 column. This is because that at
the plastic failure stage, two major horizontal cracks developed at the crater of C-13
column which delayed the occurrence of failure. Comparably, C-12 column exhibited the rupture of steel tube at the crater with the development of one major horizontal crack, resulting in rapid drop of lateral load-carrying capacity. Besides, when
the cyclic loading direction was perpendicular to the cratering face, the hysteresis
performance of the post-blast column was reduced with increasing the TNT charge
weight.
In summary, when the cyclic loading direction was perpendicular to the blast
induced crater, the plastic hinge tended to develop at the crater and further caused
the buckling of the steel tube, resulting in the low seismic resistance of the post-blast
column. When the loading direction was parallel to the cratering face, the plastic
hinge tended to develop near the bottom of column, not at the location of crater,
which indicates that the damage induced by the blast did not change the position of
the plastic hinge of the post-blast column. For the post-blast specimens under the
identical detonation scenario, the loading direction has significant influences on the
residual seismic responses of column.
12.4.2.3 Skeleton Curve
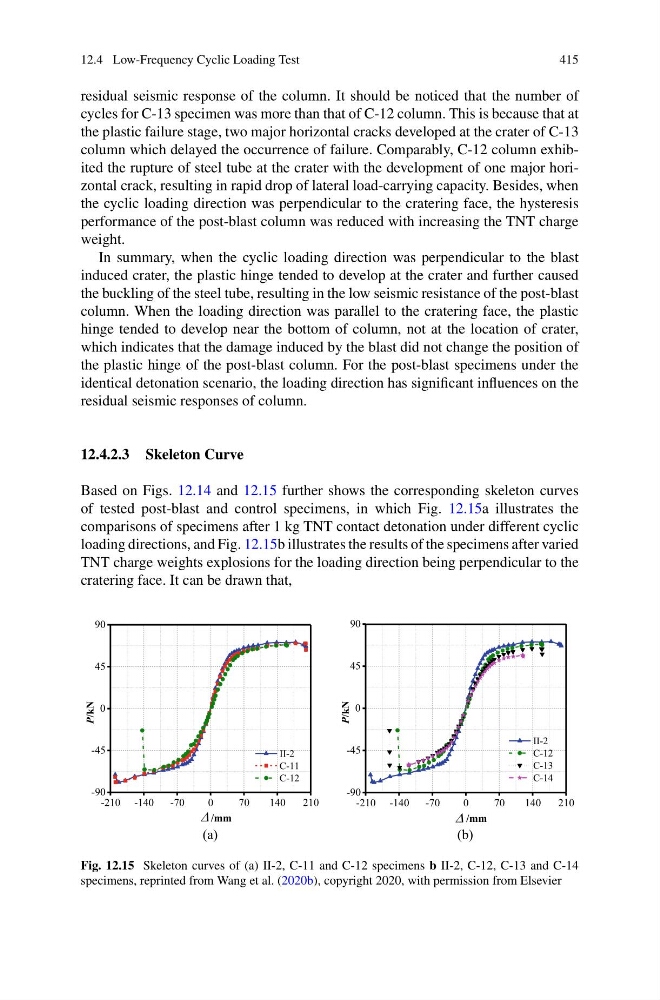
Based on Figs. 12.14 and 12.15 further shows the corresponding skeleton curves
of tested post-blast and control specimens, in which Fig. 12.15a illustrates the
comparisons of specimens after 1 kg TNT contact detonation under different cyclic
loading directions, and Fig. 12.15b illustrates the results of the specimens after varied
TNT charge weights explosions for the loading direction being perpendicular to the
cratering face. It can be drawn that,
-210 -140
-70
0
70
140
210
-90
-45
0
45
90
II-2
C-11
C-12
P/kN
/mm
-210 -140
-70
0
70
140
210
-90
-45
0
45
90
II-2
C-12
C-13
C-14
P/kN
/mm
(a)
(b)
Fig. 12.15 Skeleton curves of (a) II-2, C-11 and C-12 specimens b II-2, C-12, C-13 and C-14
specimens, reprinted from Wang et al. (2020b), copyright 2020, with permission from Elsevier
415
residual seismic response of the column. It should be noticed that the number of
cycles for C-13 specimen was more than that of C-12 column. This is because that at
the plastic failure stage, two major horizontal cracks developed at the crater of C-13
column which delayed the occurrence of failure. Comparably, C-12 column exhibited the rupture of steel tube at the crater with the development of one major horizontal crack, resulting in rapid drop of lateral load-carrying capacity. Besides, when
the cyclic loading direction was perpendicular to the cratering face, the hysteresis
performance of the post-blast column was reduced with increasing the TNT charge
weight.
In summary, when the cyclic loading direction was perpendicular to the blast
induced crater, the plastic hinge tended to develop at the crater and further caused
the buckling of the steel tube, resulting in the low seismic resistance of the post-blast
column. When the loading direction was parallel to the cratering face, the plastic
hinge tended to develop near the bottom of column, not at the location of crater,
which indicates that the damage induced by the blast did not change the position of
the plastic hinge of the post-blast column. For the post-blast specimens under the
identical detonation scenario, the loading direction has significant influences on the
residual seismic responses of column.
12.4.2.3 Skeleton Curve
Based on Figs. 12.14 and 12.15 further shows the corresponding skeleton curves
of tested post-blast and control specimens, in which Fig. 12.15a illustrates the
comparisons of specimens after 1 kg TNT contact detonation under different cyclic
loading directions, and Fig. 12.15b illustrates the results of the specimens after varied
TNT charge weights explosions for the loading direction being perpendicular to the
cratering face. It can be drawn that,
-210 -140
-70
0
70
140
210
-90
-45
0
45
90
II-2
C-11
C-12
P/kN
/mm
-210 -140
-70
0
70
140
210
-90
-45
0
45
90
II-2
C-12
C-13
C-14
P/kN
/mm
(a)
(b)
Fig. 12.15 Skeleton curves of (a) II-2, C-11 and C-12 specimens b II-2, C-12, C-13 and C-14
specimens, reprinted from Wang et al. (2020b), copyright 2020, with permission from Elsevier