

22
1 Static Mechanical Properties of UHPCC
0.0
0.5
1.0
1.5
2.0
2.5
3.0
0.0
0.5
1.0
1.5
2.0
2.5
3.0
Steel fiber content (%)
Toughness at LOP
(N m)
Micro-straight fiber
Hooked fiber
0 . 5
1 . 0
1 . 5
2 . 0
2 . 5
3 . 0
0
5
10
15
20
25
30
Steel fiber content (%)
Toughness at MOR (N m)
Micro-straight fiber
Hooked fiber
(a)
(b)
0.5
1.0
1.5
2.0
2.5
3.0
0
5
10
15
20
25
30
35
40
Steel fiber content (%)
Toughness at L/600 (N m)
Micro-straight fiber
Hooked fiber
0.5
1.0
1.5
2.0
2.5
3.0
0
20
40
60
80
100
120
140
Steel fiber content (%)
Toughness at L/150 (N m)
Micro-straight fiber
Hooked fiber
(c)
(d)
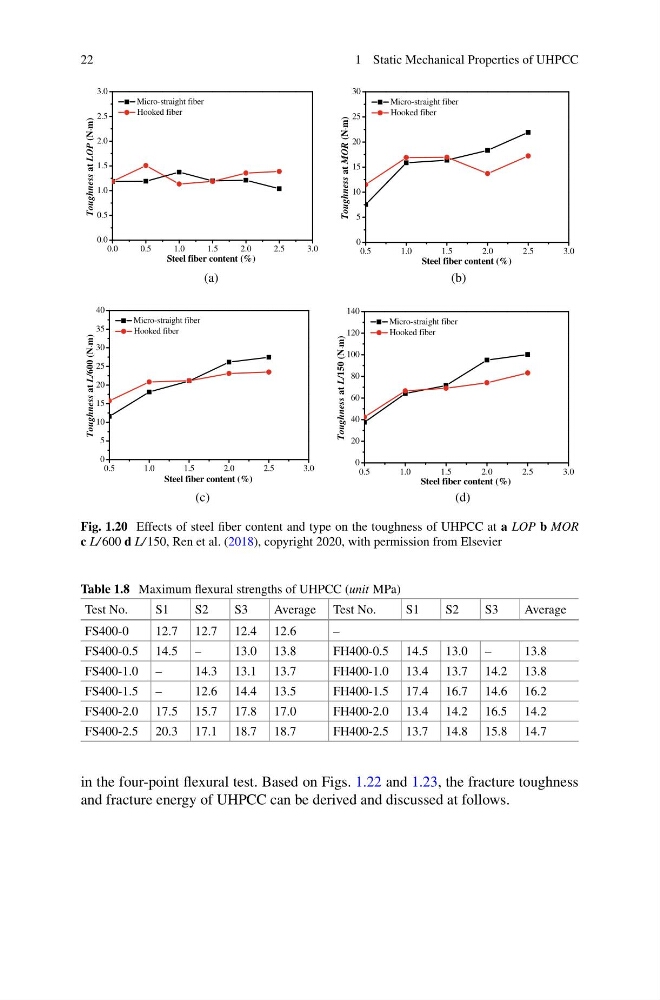
Fig. 1.20 Effects of steel fiber content and type on the toughness of UHPCC at a LOP b MOR
c L/ 600 d L/ 150, Ren et al. (2018), copyright 2020, with permission from Elsevier
Table 1.8 Maximum flexural strengths of UHPCC (unit MPa)
Test No.
S1
S2
S3
Average Test No.
S1
S2
S3
Average
FS400-0
12.7 12.7 12.4 12.6
–
FS400-0.5 14.5 –
13.0 13.8
FH400-0.5 14.5 13.0 –
13.8
FS400-1.0 –
14.3 13.1 13.7
FH400-1.0 13.4 13.7 14.2 13.8
FS400-1.5 –
12.6 14.4 13.5
FH400-1.5 17.4 16.7 14.6 16.2
FS400-2.0 17.5 15.7 17.8 17.0
FH400-2.0 13.4 14.2 16.5 14.2
FS400-2.5 20.3 17.1 18.7 18.7
FH400-2.5 13.7 14.8 15.8 14.7
in the four-point flexural test. Based on Figs. 1.22 and 1.23, the fracture toughness
and fracture energy of UHPCC can be derived and discussed at follows.
1 Static Mechanical Properties of UHPCC
0.0
0.5
1.0
1.5
2.0
2.5
3.0
0.0
0.5
1.0
1.5
2.0
2.5
3.0
Steel fiber content (%)
Toughness at LOP
(N m)
Micro-straight fiber
Hooked fiber
0 . 5
1 . 0
1 . 5
2 . 0
2 . 5
3 . 0
0
5
10
15
20
25
30
Steel fiber content (%)
Toughness at MOR (N m)
Micro-straight fiber
Hooked fiber
(a)
(b)
0.5
1.0
1.5
2.0
2.5
3.0
0
5
10
15
20
25
30
35
40
Steel fiber content (%)
Toughness at L/600 (N m)
Micro-straight fiber
Hooked fiber
0.5
1.0
1.5
2.0
2.5
3.0
0
20
40
60
80
100
120
140
Steel fiber content (%)
Toughness at L/150 (N m)
Micro-straight fiber
Hooked fiber
(c)
(d)
Fig. 1.20 Effects of steel fiber content and type on the toughness of UHPCC at a LOP b MOR
c L/ 600 d L/ 150, Ren et al. (2018), copyright 2020, with permission from Elsevier
Table 1.8 Maximum flexural strengths of UHPCC (unit MPa)
Test No.
S1
S2
S3
Average Test No.
S1
S2
S3
Average
FS400-0
12.7 12.7 12.4 12.6
–
FS400-0.5 14.5 –
13.0 13.8
FH400-0.5 14.5 13.0 –
13.8
FS400-1.0 –
14.3 13.1 13.7
FH400-1.0 13.4 13.7 14.2 13.8
FS400-1.5 –
12.6 14.4 13.5
FH400-1.5 17.4 16.7 14.6 16.2
FS400-2.0 17.5 15.7 17.8 17.0
FH400-2.0 13.4 14.2 16.5 14.2
FS400-2.5 20.3 17.1 18.7 18.7
FH400-2.5 13.7 14.8 15.8 14.7
in the four-point flexural test. Based on Figs. 1.22 and 1.23, the fracture toughness
and fracture energy of UHPCC can be derived and discussed at follows.