

11.4 Further Numerical Analyses and Discussion
389
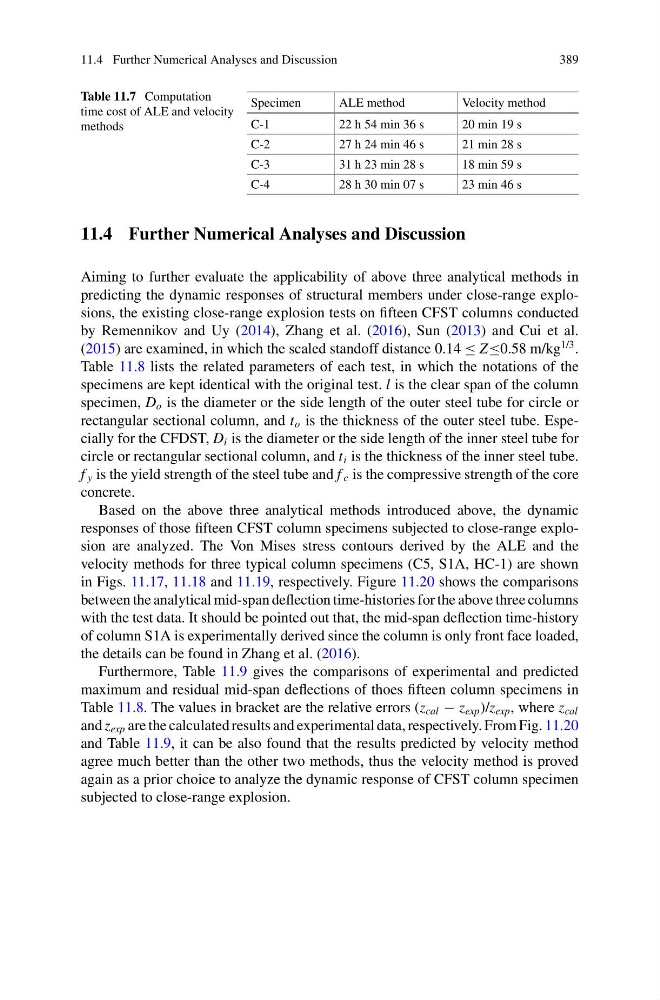
Table 11.7 Computation
time cost of ALE and velocity
methods
Specimen
ALE method
Velocity method
C-1
22 h 54 min 36 s
20 min 19 s
C-2
27 h 24 min 46 s
21 min 28 s
C-3
31 h 23 min 28 s
18 min 59 s
C-4
28 h 30 min 07 s
23 min 46 s
11.4 Further Numerical Analyses and Discussion
Aiming to further evaluate the applicability of above three analytical methods in
predicting the dynamic responses of structural members under close-range explosions, the existing close-range explosion tests on fifteen CFST columns conducted
by Remennikov and Uy (2014), Zhang et al. (2016), Sun (2013) and Cui et al.
(2015) are examined, in which the scaled standoff distance 0.14 ≤ Z≤0.58 m/kg
1/3 .
Table 11.8 lists the related parameters of each test, in which the notations of the
specimens are kept identical with the original test. l is the clear span of the column
specimen, D o is the diameter or the side length of the outer steel tube for circle or
rectangular sectional column, and t o is the thickness of the outer steel tube. Especially for the CFDST, D i is the diameter or the side length of the inner steel tube for
circle or rectangular sectional column, and t i is the thickness of the inner steel tube.
f y is the yield strength of the steel tube and f c is the compressive strength of the core
concrete.
Based on the above three analytical methods introduced above, the dynamic
responses of those fifteen CFST column specimens subjected to close-range explosion are analyzed. The Von Mises stress contours derived by the ALE and the
velocity methods for three typical column specimens (C5, S1A, HC-1) are shown
in Figs. 11.17, 11.18 and 11.19, respectively. Figure 11.20 shows the comparisons
between the analytical mid-span deflection time-histories for the above three columns
with the test data. It should be pointed out that, the mid-span deflection time-history
of column S1A is experimentally derived since the column is only front face loaded,
the details can be found in Zhang et al. (2016).
Furthermore, Table 11.9 gives the comparisons of experimental and predicted
maximum and residual mid-span deflections of thoes fifteen column specimens in
Table 11.8. The values in bracket are the relative errors (z cal − z exp )/z exp , where z cal
and z exp are the calculated results and experimental data, respectively. From Fig. 11.20
and Table 11.9, it can be also found that the results predicted by velocity method
agree much better than the other two methods, thus the velocity method is proved
again as a prior choice to analyze the dynamic response of CFST column specimen
subjected to close-range explosion.
389
Table 11.7 Computation
time cost of ALE and velocity
methods
Specimen
ALE method
Velocity method
C-1
22 h 54 min 36 s
20 min 19 s
C-2
27 h 24 min 46 s
21 min 28 s
C-3
31 h 23 min 28 s
18 min 59 s
C-4
28 h 30 min 07 s
23 min 46 s
11.4 Further Numerical Analyses and Discussion
Aiming to further evaluate the applicability of above three analytical methods in
predicting the dynamic responses of structural members under close-range explosions, the existing close-range explosion tests on fifteen CFST columns conducted
by Remennikov and Uy (2014), Zhang et al. (2016), Sun (2013) and Cui et al.
(2015) are examined, in which the scaled standoff distance 0.14 ≤ Z≤0.58 m/kg
1/3 .
Table 11.8 lists the related parameters of each test, in which the notations of the
specimens are kept identical with the original test. l is the clear span of the column
specimen, D o is the diameter or the side length of the outer steel tube for circle or
rectangular sectional column, and t o is the thickness of the outer steel tube. Especially for the CFDST, D i is the diameter or the side length of the inner steel tube for
circle or rectangular sectional column, and t i is the thickness of the inner steel tube.
f y is the yield strength of the steel tube and f c is the compressive strength of the core
concrete.
Based on the above three analytical methods introduced above, the dynamic
responses of those fifteen CFST column specimens subjected to close-range explosion are analyzed. The Von Mises stress contours derived by the ALE and the
velocity methods for three typical column specimens (C5, S1A, HC-1) are shown
in Figs. 11.17, 11.18 and 11.19, respectively. Figure 11.20 shows the comparisons
between the analytical mid-span deflection time-histories for the above three columns
with the test data. It should be pointed out that, the mid-span deflection time-history
of column S1A is experimentally derived since the column is only front face loaded,
the details can be found in Zhang et al. (2016).
Furthermore, Table 11.9 gives the comparisons of experimental and predicted
maximum and residual mid-span deflections of thoes fifteen column specimens in
Table 11.8. The values in bracket are the relative errors (z cal − z exp )/z exp , where z cal
and z exp are the calculated results and experimental data, respectively. From Fig. 11.20
and Table 11.9, it can be also found that the results predicted by velocity method
agree much better than the other two methods, thus the velocity method is proved
again as a prior choice to analyze the dynamic response of CFST column specimen
subjected to close-range explosion.