

1.4 Test Results and Discussion
17
and type on the tensile strength of UHPCC. It can be found that, with the volume
fraction increasing from 0.5 to 2.0%, the tensile strengths of UHPCC with microstraight steel fiber increase by 19.2 ~ 37.7% compared to the tensile strength of plain
UHPCC (N500-0, 6.50 MPa), and the corresponding values with hooked steel fiber
only increase by 3.8 ~ 15.8%. Therefore, the tensile strength of UHPCC increases
with the rising of the steel fiber mixing ratio, and the strengthening effect of microstraight steel fiber is more remarkable due to the larger amount. As is not expected,
for the UHPCC specimens with micro-straight steel fibers, the tensile strength for
2.5% volumetric ratio and post-peak stress for 2.0% volumetric ratio are relatively
small, which may be caused by the casting quality and the measuring deviations.
1.4.3 Four-Point Flexure Test
1.4.3.1 Four-Point Flexural Load–Deflection Curves
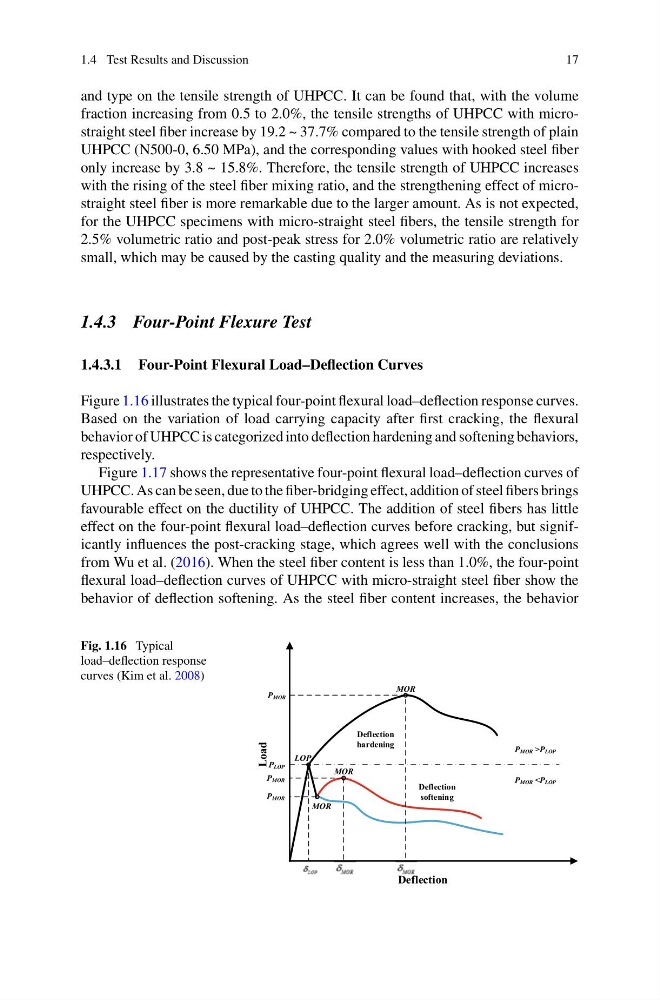
Figure 1.16 illustrates the typical four-point flexural load–deflection response curves.
Based on the variation of load carrying capacity after first cracking, the flexural
behavior of UHPCC is categorized into deflection hardening and softening behaviors,
respectively.
Figure 1.17 shows the representative four-point flexural load–deflection curves of
UHPCC. As can be seen, due to the fiber-bridging effect, addition of steel fibers brings
favourable effect on the ductility of UHPCC. The addition of steel fibers has little
effect on the four-point flexural load–deflection curves before cracking, but significantly influences the post-cracking stage, which agrees well with the conclusions
from Wu et al. (2016). When the steel fiber content is less than 1.0%, the four-point
flexural load–deflection curves of UHPCC with micro-straight steel fiber show the
behavior of deflection softening. As the steel fiber content increases, the behavior
Fig. 1.16 Typical
load–deflection response
curves (Kim et al. 2008)
17
and type on the tensile strength of UHPCC. It can be found that, with the volume
fraction increasing from 0.5 to 2.0%, the tensile strengths of UHPCC with microstraight steel fiber increase by 19.2 ~ 37.7% compared to the tensile strength of plain
UHPCC (N500-0, 6.50 MPa), and the corresponding values with hooked steel fiber
only increase by 3.8 ~ 15.8%. Therefore, the tensile strength of UHPCC increases
with the rising of the steel fiber mixing ratio, and the strengthening effect of microstraight steel fiber is more remarkable due to the larger amount. As is not expected,
for the UHPCC specimens with micro-straight steel fibers, the tensile strength for
2.5% volumetric ratio and post-peak stress for 2.0% volumetric ratio are relatively
small, which may be caused by the casting quality and the measuring deviations.
1.4.3 Four-Point Flexure Test
1.4.3.1 Four-Point Flexural Load–Deflection Curves
Figure 1.16 illustrates the typical four-point flexural load–deflection response curves.
Based on the variation of load carrying capacity after first cracking, the flexural
behavior of UHPCC is categorized into deflection hardening and softening behaviors,
respectively.
Figure 1.17 shows the representative four-point flexural load–deflection curves of
UHPCC. As can be seen, due to the fiber-bridging effect, addition of steel fibers brings
favourable effect on the ductility of UHPCC. The addition of steel fibers has little
effect on the four-point flexural load–deflection curves before cracking, but significantly influences the post-cracking stage, which agrees well with the conclusions
from Wu et al. (2016). When the steel fiber content is less than 1.0%, the four-point
flexural load–deflection curves of UHPCC with micro-straight steel fiber show the
behavior of deflection softening. As the steel fiber content increases, the behavior
Fig. 1.16 Typical
load–deflection response
curves (Kim et al. 2008)