

354
10 Residual Axial Capacity of UHPCC-FST Column Under …
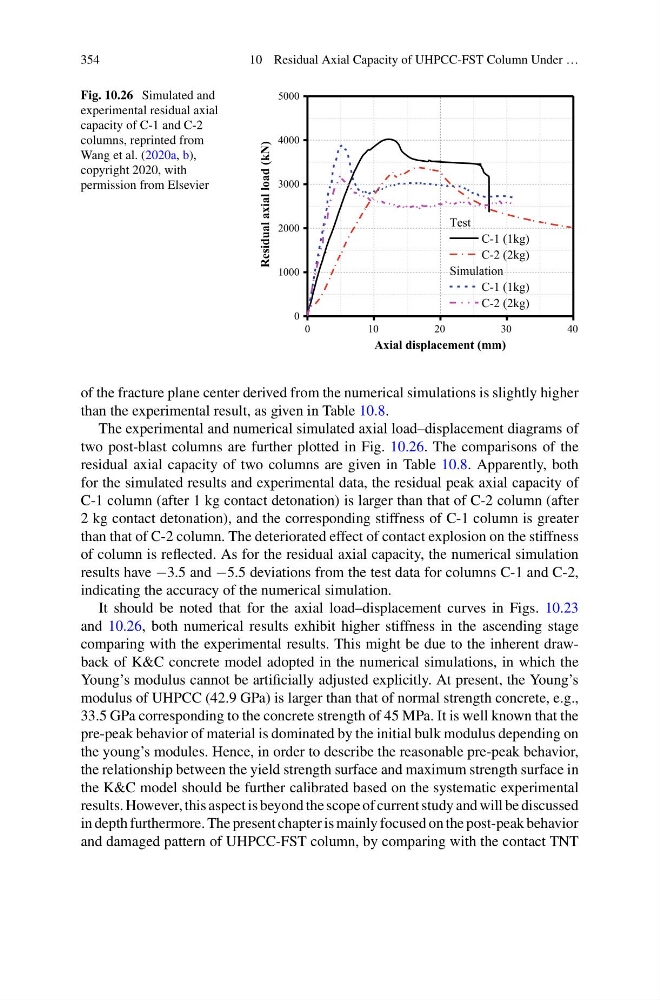
Fig. 10.26 Simulated and
experimental residual axial
capacity of C-1 and C-2
columns, reprinted from
Wang et al. (2020a, b),
copyright 2020, with
permission from Elsevier
0
1 0
2 0
3 0
4 0
0
1000
2000
3000
4000
5000
Residual axial load (kN)
Axial displacement (mm)
Test
C-1 (1kg)
C-2 (2kg)
Simulation
C-1 (1kg)
C-2 (2kg)
of the fracture plane center derived from the numerical simulations is slightly higher
than the experimental result, as given in Table 10.8.
The experimental and numerical simulated axial load–displacement diagrams of
two post-blast columns are further plotted in Fig. 10.26. The comparisons of the
residual axial capacity of two columns are given in Table 10.8. Apparently, both
for the simulated results and experimental data, the residual peak axial capacity of
C-1 column (after 1 kg contact detonation) is larger than that of C-2 column (after
2 kg contact detonation), and the corresponding stiffness of C-1 column is greater
than that of C-2 column. The deteriorated effect of contact explosion on the stiffness
of column is reflected. As for the residual axial capacity, the numerical simulation
results have −3.5 and −5.5 deviations from the test data for columns C-1 and C-2,
indicating the accuracy of the numerical simulation.
It should be noted that for the axial load–displacement curves in Figs. 10.23
and 10.26, both numerical results exhibit higher stiffness in the ascending stage
comparing with the experimental results. This might be due to the inherent drawback of K&C concrete model adopted in the numerical simulations, in which the
Young’s modulus cannot be artificially adjusted explicitly. At present, the Young’s
modulus of UHPCC (42.9 GPa) is larger than that of normal strength concrete, e.g.,
33.5 GPa corresponding to the concrete strength of 45 MPa. It is well known that the
pre-peak behavior of material is dominated by the initial bulk modulus depending on
the young’s modules. Hence, in order to describe the reasonable pre-peak behavior,
the relationship between the yield strength surface and maximum strength surface in
the K&C model should be further calibrated based on the systematic experimental
results. However, this aspect is beyond the scope of current study and will be discussed
in depth furthermore. The present chapter is mainly focused on the post-peak behavior
and damaged pattern of UHPCC-FST column, by comparing with the contact TNT
10 Residual Axial Capacity of UHPCC-FST Column Under …
Fig. 10.26 Simulated and
experimental residual axial
capacity of C-1 and C-2
columns, reprinted from
Wang et al. (2020a, b),
copyright 2020, with
permission from Elsevier
0
1 0
2 0
3 0
4 0
0
1000
2000
3000
4000
5000
Residual axial load (kN)
Axial displacement (mm)
Test
C-1 (1kg)
C-2 (2kg)
Simulation
C-1 (1kg)
C-2 (2kg)
of the fracture plane center derived from the numerical simulations is slightly higher
than the experimental result, as given in Table 10.8.
The experimental and numerical simulated axial load–displacement diagrams of
two post-blast columns are further plotted in Fig. 10.26. The comparisons of the
residual axial capacity of two columns are given in Table 10.8. Apparently, both
for the simulated results and experimental data, the residual peak axial capacity of
C-1 column (after 1 kg contact detonation) is larger than that of C-2 column (after
2 kg contact detonation), and the corresponding stiffness of C-1 column is greater
than that of C-2 column. The deteriorated effect of contact explosion on the stiffness
of column is reflected. As for the residual axial capacity, the numerical simulation
results have −3.5 and −5.5 deviations from the test data for columns C-1 and C-2,
indicating the accuracy of the numerical simulation.
It should be noted that for the axial load–displacement curves in Figs. 10.23
and 10.26, both numerical results exhibit higher stiffness in the ascending stage
comparing with the experimental results. This might be due to the inherent drawback of K&C concrete model adopted in the numerical simulations, in which the
Young’s modulus cannot be artificially adjusted explicitly. At present, the Young’s
modulus of UHPCC (42.9 GPa) is larger than that of normal strength concrete, e.g.,
33.5 GPa corresponding to the concrete strength of 45 MPa. It is well known that the
pre-peak behavior of material is dominated by the initial bulk modulus depending on
the young’s modules. Hence, in order to describe the reasonable pre-peak behavior,
the relationship between the yield strength surface and maximum strength surface in
the K&C model should be further calibrated based on the systematic experimental
results. However, this aspect is beyond the scope of current study and will be discussed
in depth furthermore. The present chapter is mainly focused on the post-peak behavior
and damaged pattern of UHPCC-FST column, by comparing with the contact TNT