

9.4 Numerical Simulation
301
0.00 0.01 0.02 0.03 0.04 0.05 0.06
0
5
10
15
20
25
30
Mid-deflection (mm)
Time (s)
Test
5mm
10mm
20mm
30mm
(a)
(b)
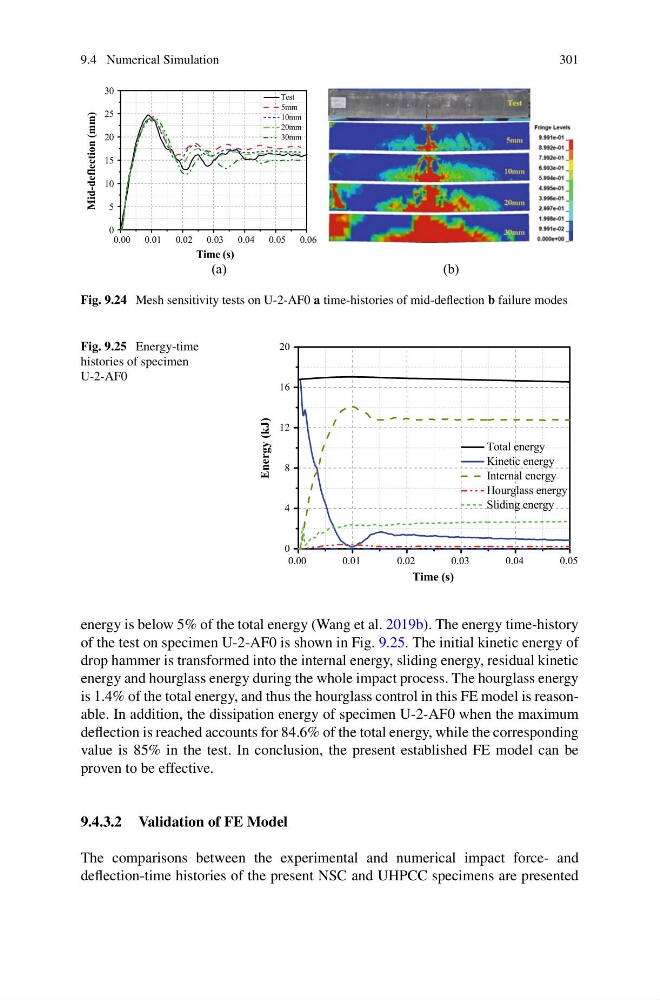
Fig. 9.24 Mesh sensitivity tests on U-2-AF0 a time-histories of mid-deflection b failure modes
Fig. 9.25 Energy-time
histories of specimen
U-2-AF0
0.00
0.01
0.02
0.03
0.04
0.05
0
4
8
12
16
20
Energy (kJ)
Time (s)
Total energy
Kinetic energy
Internal energy
Hourglass energy
Sliding energy
energy is below 5% of the total energy (Wang et al. 2019b). The energy time-history
of the test on specimen U-2-AF0 is shown in Fig. 9.25. The initial kinetic energy of
drop hammer is transformed into the internal energy, sliding energy, residual kinetic
energy and hourglass energy during the whole impact process. The hourglass energy
is 1.4% of the total energy, and thus the hourglass control in this FE model is reasonable. In addition, the dissipation energy of specimen U-2-AF0 when the maximum
deflection is reached accounts for 84.6% of the total energy, while the corresponding
value is 85% in the test. In conclusion, the present established FE model can be
proven to be effective.
9.4.3.2 Validation of FE Model
The comparisons between the experimental and numerical impact force- and
deflection-time histories of the present NSC and UHPCC specimens are presented
301
0.00 0.01 0.02 0.03 0.04 0.05 0.06
0
5
10
15
20
25
30
Mid-deflection (mm)
Time (s)
Test
5mm
10mm
20mm
30mm
(a)
(b)
Fig. 9.24 Mesh sensitivity tests on U-2-AF0 a time-histories of mid-deflection b failure modes
Fig. 9.25 Energy-time
histories of specimen
U-2-AF0
0.00
0.01
0.02
0.03
0.04
0.05
0
4
8
12
16
20
Energy (kJ)
Time (s)
Total energy
Kinetic energy
Internal energy
Hourglass energy
Sliding energy
energy is below 5% of the total energy (Wang et al. 2019b). The energy time-history
of the test on specimen U-2-AF0 is shown in Fig. 9.25. The initial kinetic energy of
drop hammer is transformed into the internal energy, sliding energy, residual kinetic
energy and hourglass energy during the whole impact process. The hourglass energy
is 1.4% of the total energy, and thus the hourglass control in this FE model is reasonable. In addition, the dissipation energy of specimen U-2-AF0 when the maximum
deflection is reached accounts for 84.6% of the total energy, while the corresponding
value is 85% in the test. In conclusion, the present established FE model can be
proven to be effective.
9.4.3.2 Validation of FE Model
The comparisons between the experimental and numerical impact force- and
deflection-time histories of the present NSC and UHPCC specimens are presented