

298
9 Dynamic Responses of Reinforced UHPCC Members Under …
0
1 0
2 0
3 0
4 0
5 0
6 0
0
3
6
9
12
15
Strain rate (s
-1
)
DIF of UHPC in tensile
Test data (Wu et al. 2018)
Fitting curve
0
5
10
15
20
25
30
1.00
1.05
1.10
1.15
1.20
1.25
1.30
Test data (Ren et al. 2018)
Fitting curve
DIF of UHPC in compression
Strain rate (s
-1
)
(a)
(b)
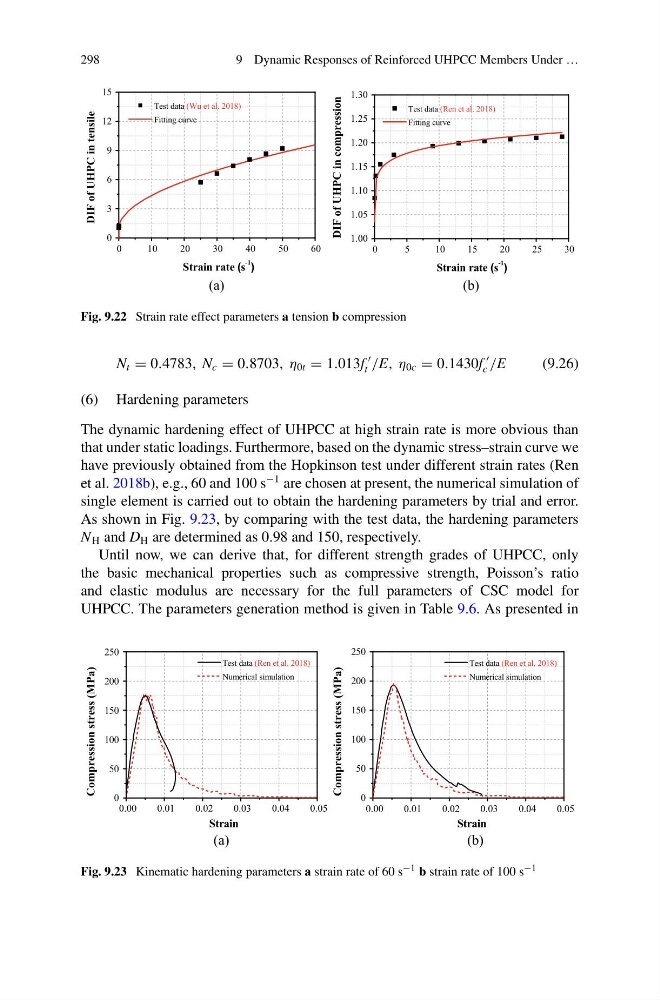
Fig. 9.22 Strain rate effect parameters a tension b compression
N t = 0.4783, N c = 0.8703, η 0t = 1.013f
t /E, η 0c = 0.1430f
c /E
(9.26)
(6) Hardening parameters
The dynamic hardening effect of UHPCC at high strain rate is more obvious than
that under static loadings. Furthermore, based on the dynamic stress–strain curve we
have previously obtained from the Hopkinson test under different strain rates (Ren
et al. 2018b), e.g., 60 and 100 s
−1 are chosen at present, the numerical simulation of
single element is carried out to obtain the hardening parameters by trial and error.
As shown in Fig. 9.23, by comparing with the test data, the hardening parameters
N H and D H are determined as 0.98 and 150, respectively.
Until now, we can derive that, for different strength grades of UHPCC, only
the basic mechanical properties such as compressive strength, Poisson’s ratio
and elastic modulus are necessary for the full parameters of CSC model for
UHPCC. The parameters generation method is given in Table 9.6. As presented in
0.00
0.01
0.02
0.03
0.04
0.05
0
50
100
150
200
250
Compression stress (MPa)
Strain
Test data (Ren et al. 2018)
Numerical simulation
0.00
0.01
0.02
0.03
0.04
0.05
0
50
100
150
200
250
Compression stress (MPa)
Test data (Ren et al. 2018)
Numerical simulation
Strain
(a)
(b)
Fig. 9.23 Kinematic hardening parameters a strain rate of 60 s −1 b strain rate of 100 s −1
9 Dynamic Responses of Reinforced UHPCC Members Under …
0
1 0
2 0
3 0
4 0
5 0
6 0
0
3
6
9
12
15
Strain rate (s
-1
)
DIF of UHPC in tensile
Test data (Wu et al. 2018)
Fitting curve
0
5
10
15
20
25
30
1.00
1.05
1.10
1.15
1.20
1.25
1.30
Test data (Ren et al. 2018)
Fitting curve
DIF of UHPC in compression
Strain rate (s
-1
)
(a)
(b)
Fig. 9.22 Strain rate effect parameters a tension b compression
N t = 0.4783, N c = 0.8703, η 0t = 1.013f
t /E, η 0c = 0.1430f
c /E
(9.26)
(6) Hardening parameters
The dynamic hardening effect of UHPCC at high strain rate is more obvious than
that under static loadings. Furthermore, based on the dynamic stress–strain curve we
have previously obtained from the Hopkinson test under different strain rates (Ren
et al. 2018b), e.g., 60 and 100 s
−1 are chosen at present, the numerical simulation of
single element is carried out to obtain the hardening parameters by trial and error.
As shown in Fig. 9.23, by comparing with the test data, the hardening parameters
N H and D H are determined as 0.98 and 150, respectively.
Until now, we can derive that, for different strength grades of UHPCC, only
the basic mechanical properties such as compressive strength, Poisson’s ratio
and elastic modulus are necessary for the full parameters of CSC model for
UHPCC. The parameters generation method is given in Table 9.6. As presented in
0.00
0.01
0.02
0.03
0.04
0.05
0
50
100
150
200
250
Compression stress (MPa)
Strain
Test data (Ren et al. 2018)
Numerical simulation
0.00
0.01
0.02
0.03
0.04
0.05
0
50
100
150
200
250
Compression stress (MPa)
Test data (Ren et al. 2018)
Numerical simulation
Strain
(a)
(b)
Fig. 9.23 Kinematic hardening parameters a strain rate of 60 s −1 b strain rate of 100 s −1