

8.5 Numerical Simulation
263
mesh. Besides, using mesh sizes of 6 mm and 10 mm yields very close numerical
results. Considering the computational efficiency, 10 mm mesh was used for the
present numerical simulation.
8.5.1.4 Comparisons of Numerical Results with Test Data
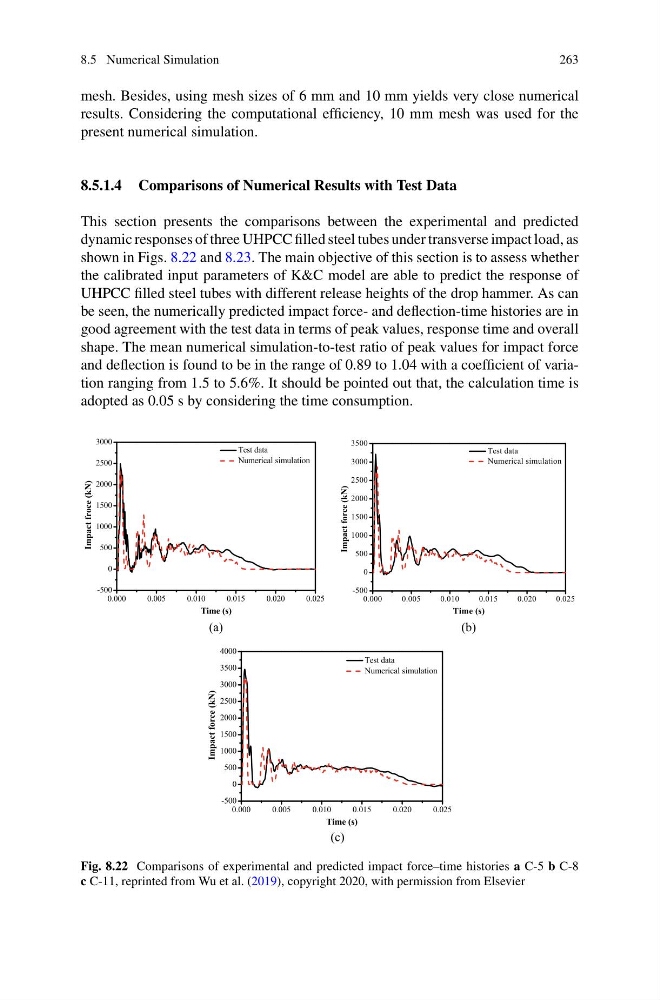
This section presents the comparisons between the experimental and predicted
dynamic responses of three UHPCC filled steel tubes under transverse impact load, as
shown in Figs. 8.22 and 8.23. The main objective of this section is to assess whether
the calibrated input parameters of K&C model are able to predict the response of
UHPCC filled steel tubes with different release heights of the drop hammer. As can
be seen, the numerically predicted impact force- and deflection-time histories are in
good agreement with the test data in terms of peak values, response time and overall
shape. The mean numerical simulation-to-test ratio of peak values for impact force
and deflection is found to be in the range of 0.89 to 1.04 with a coefficient of variation ranging from 1.5 to 5.6%. It should be pointed out that, the calculation time is
adopted as 0.05 s by considering the time consumption.
Fig. 8.22 Comparisons of experimental and predicted impact force–time histories a C-5 b C-8
c C-11, reprinted from Wu et al. (2019), copyright 2020, with permission from Elsevier
263
mesh. Besides, using mesh sizes of 6 mm and 10 mm yields very close numerical
results. Considering the computational efficiency, 10 mm mesh was used for the
present numerical simulation.
8.5.1.4 Comparisons of Numerical Results with Test Data
This section presents the comparisons between the experimental and predicted
dynamic responses of three UHPCC filled steel tubes under transverse impact load, as
shown in Figs. 8.22 and 8.23. The main objective of this section is to assess whether
the calibrated input parameters of K&C model are able to predict the response of
UHPCC filled steel tubes with different release heights of the drop hammer. As can
be seen, the numerically predicted impact force- and deflection-time histories are in
good agreement with the test data in terms of peak values, response time and overall
shape. The mean numerical simulation-to-test ratio of peak values for impact force
and deflection is found to be in the range of 0.89 to 1.04 with a coefficient of variation ranging from 1.5 to 5.6%. It should be pointed out that, the calculation time is
adopted as 0.05 s by considering the time consumption.
Fig. 8.22 Comparisons of experimental and predicted impact force–time histories a C-5 b C-8
c C-11, reprinted from Wu et al. (2019), copyright 2020, with permission from Elsevier