

8.4 Calibration of K&C Model Parameters for UHPCC
259
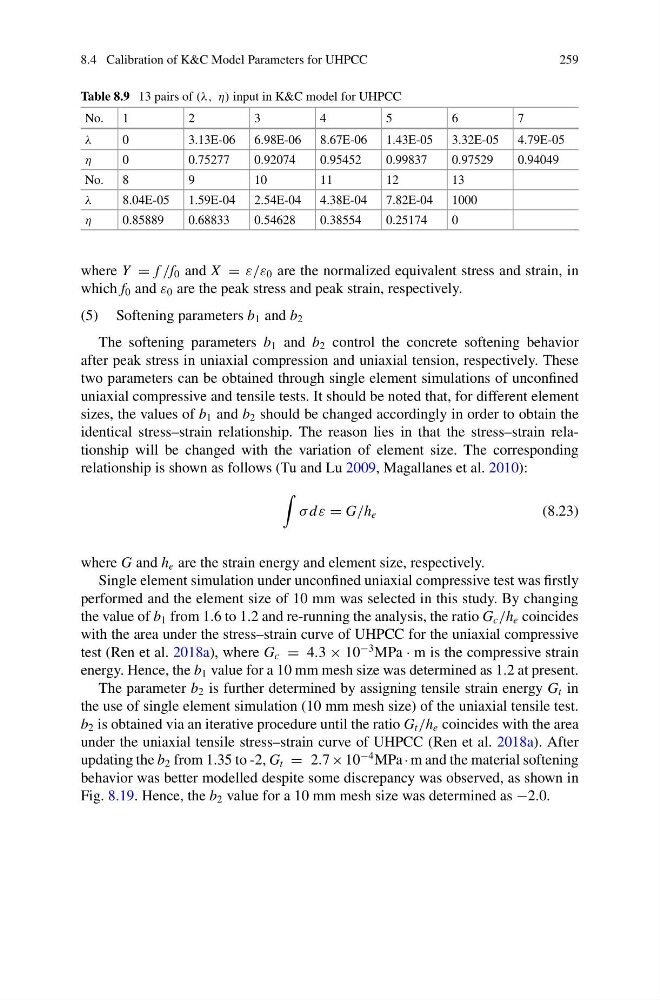
Table 8.9 13 pairs of (λ, η) input in K&C model for UHPCC
No. 1
2
3
4
5
6
7
λ
0
3.13E-06 6.98E-06 8.67E-06 1.43E-05 3.32E-05 4.79E-05
η
0
0.75277
0.92074
0.95452
0.99837
0.97529
0.94049
No. 8
9
10
11
12
13
λ
8.04E-05 1.59E-04 2.54E-04 4.38E-04 7.82E-04 1000
η
0.85889
0.68833
0.54628
0.38554
0.25174
0
where Y = f /f 0 and X = ε/ε 0 are the normalized equivalent stress and strain, in
which f 0 and ε 0 are the peak stress and peak strain, respectively.
(5) Softening parameters b 1 and b 2
The softening parameters b 1 and b 2 control the concrete softening behavior
after peak stress in uniaxial compression and uniaxial tension, respectively. These
two parameters can be obtained through single element simulations of unconfined
uniaxial compressive and tensile tests. It should be noted that, for different element
sizes, the values of b 1 and b 2 should be changed accordingly in order to obtain the
identical stress–strain relationship. The reason lies in that the stress–strain relationship will be changed with the variation of element size. The corresponding
relationship is shown as follows (Tu and Lu 2009, Magallanes et al. 2010):
σ d ε = G/h e
(8.23)
where G and h e are the strain energy and element size, respectively.
Single element simulation under unconfined uniaxial compressive test was firstly
performed and the element size of 10 mm was selected in this study. By changing
the value of b 1 from 1.6 to 1.2 and re-running the analysis, the ratio G c /h e coincides
with the area under the stress–strain curve of UHPCC for the uniaxial compressive
test (Ren et al. 2018a), where G c = 4.3 × 10
−3 MPa · m is the compressive strain
energy. Hence, the b 1 value for a 10 mm mesh size was determined as 1.2 at present.
The parameter b 2 is further determined by assigning tensile strain energy G t in
the use of single element simulation (10 mm mesh size) of the uniaxial tensile test.
b 2 is obtained via an iterative procedure until the ratio G t /h e coincides with the area
under the uniaxial tensile stress–strain curve of UHPCC (Ren et al. 2018a). After
updating the b 2 from 1.35 to -2, G t = 2.7 × 10
−4 MPa · m and the material softening
behavior was better modelled despite some discrepancy was observed, as shown in
Fig. 8.19. Hence, the b 2 value for a 10 mm mesh size was determined as −2.0.
259
Table 8.9 13 pairs of (λ, η) input in K&C model for UHPCC
No. 1
2
3
4
5
6
7
λ
0
3.13E-06 6.98E-06 8.67E-06 1.43E-05 3.32E-05 4.79E-05
η
0
0.75277
0.92074
0.95452
0.99837
0.97529
0.94049
No. 8
9
10
11
12
13
λ
8.04E-05 1.59E-04 2.54E-04 4.38E-04 7.82E-04 1000
η
0.85889
0.68833
0.54628
0.38554
0.25174
0
where Y = f /f 0 and X = ε/ε 0 are the normalized equivalent stress and strain, in
which f 0 and ε 0 are the peak stress and peak strain, respectively.
(5) Softening parameters b 1 and b 2
The softening parameters b 1 and b 2 control the concrete softening behavior
after peak stress in uniaxial compression and uniaxial tension, respectively. These
two parameters can be obtained through single element simulations of unconfined
uniaxial compressive and tensile tests. It should be noted that, for different element
sizes, the values of b 1 and b 2 should be changed accordingly in order to obtain the
identical stress–strain relationship. The reason lies in that the stress–strain relationship will be changed with the variation of element size. The corresponding
relationship is shown as follows (Tu and Lu 2009, Magallanes et al. 2010):
σ d ε = G/h e
(8.23)
where G and h e are the strain energy and element size, respectively.
Single element simulation under unconfined uniaxial compressive test was firstly
performed and the element size of 10 mm was selected in this study. By changing
the value of b 1 from 1.6 to 1.2 and re-running the analysis, the ratio G c /h e coincides
with the area under the stress–strain curve of UHPCC for the uniaxial compressive
test (Ren et al. 2018a), where G c = 4.3 × 10
−3 MPa · m is the compressive strain
energy. Hence, the b 1 value for a 10 mm mesh size was determined as 1.2 at present.
The parameter b 2 is further determined by assigning tensile strain energy G t in
the use of single element simulation (10 mm mesh size) of the uniaxial tensile test.
b 2 is obtained via an iterative procedure until the ratio G t /h e coincides with the area
under the uniaxial tensile stress–strain curve of UHPCC (Ren et al. 2018a). After
updating the b 2 from 1.35 to -2, G t = 2.7 × 10
−4 MPa · m and the material softening
behavior was better modelled despite some discrepancy was observed, as shown in
Fig. 8.19. Hence, the b 2 value for a 10 mm mesh size was determined as −2.0.