

5.4 Numerical Simulations Based on 3D Mesoscopic Concrete Model
139
1998) is adopted to generate the evenly distributed pseudo-random numbers to simulate the random distribution of coarse aggregates within the concrete matrix. The
rand function which defaults to Mersenne Twister algorithm is invoked by the mathematics software MATLAB to generate the random variables evenly distributed on
the interval [0, 1], which are then used to determine the location of coarse aggregates.
The distribution of coarse aggregates size is very important for establishing 3D
mesoscopic concrete models, because it has a significant influence on the concrete
performance. Therefore, it is necessary to consider the gradation of coarse aggregates.
Fuller and Thompson (1907) proposed the continuous gradation curve to optimize
the density and strength of concrete, namely the Fuller curve as follows
F = 100
d a
d a, max
0.5
(5.1)
where F is the cumulative percentage of coarse aggregates passing the sieve with
diameter d a ; d a and d a, max are the size and maximum size of coarse aggregates,
respectively.
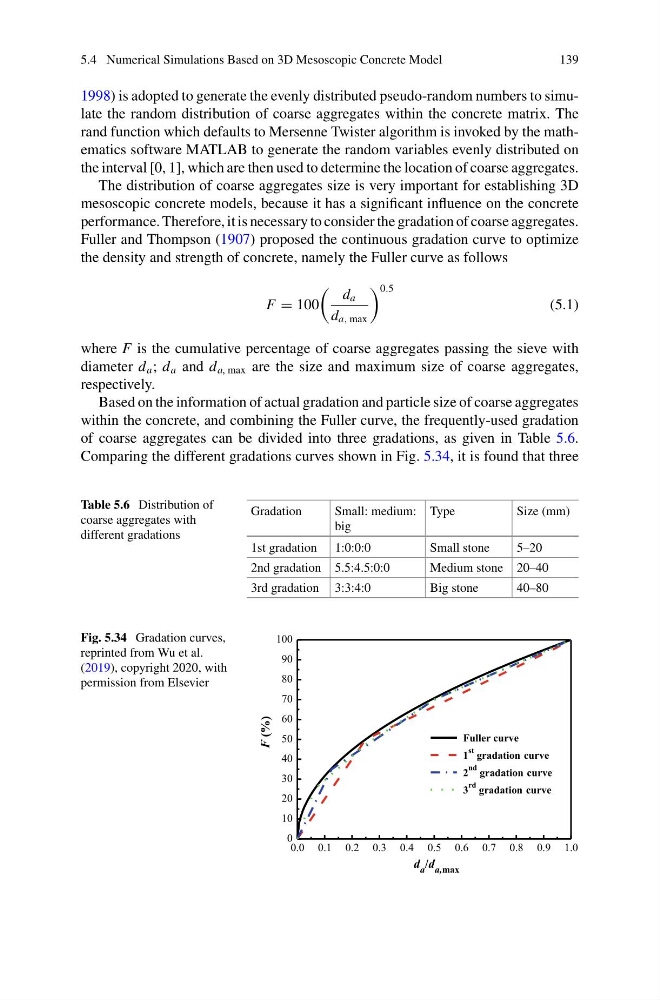
Based on the information of actual gradation and particle size of coarse aggregates
within the concrete, and combining the Fuller curve, the frequently-used gradation
of coarse aggregates can be divided into three gradations, as given in Table 5.6.
Comparing the different gradations curves shown in Fig. 5.34, it is found that three
Table 5.6 Distribution of
coarse aggregates with
different gradations
Gradation
Small: medium:
big
Type
Size (mm)
1st gradation 1:0:0:0
Small stone
5–20
2nd gradation 5.5:4.5:0:0
Medium stone 20–40
3rd gradation 3:3:4:0
Big stone
40–80
Fig. 5.34 Gradation curves,
reprinted from Wu et al.
(2019), copyright 2020, with
permission from Elsevier
0.0 0.1 0.2 0.3 0.4 0.5 0.6 0.7 0.8 0.9 1.0
0
10
20
30
40
50
60
70
80
90
100
F (%)
d a /d a,max
Fuller curve
1
st gradation curve
2
nd gradation curve
3
rd gradation curve
139
1998) is adopted to generate the evenly distributed pseudo-random numbers to simulate the random distribution of coarse aggregates within the concrete matrix. The
rand function which defaults to Mersenne Twister algorithm is invoked by the mathematics software MATLAB to generate the random variables evenly distributed on
the interval [0, 1], which are then used to determine the location of coarse aggregates.
The distribution of coarse aggregates size is very important for establishing 3D
mesoscopic concrete models, because it has a significant influence on the concrete
performance. Therefore, it is necessary to consider the gradation of coarse aggregates.
Fuller and Thompson (1907) proposed the continuous gradation curve to optimize
the density and strength of concrete, namely the Fuller curve as follows
F = 100
d a
d a, max
0.5
(5.1)
where F is the cumulative percentage of coarse aggregates passing the sieve with
diameter d a ; d a and d a, max are the size and maximum size of coarse aggregates,
respectively.
Based on the information of actual gradation and particle size of coarse aggregates
within the concrete, and combining the Fuller curve, the frequently-used gradation
of coarse aggregates can be divided into three gradations, as given in Table 5.6.
Comparing the different gradations curves shown in Fig. 5.34, it is found that three
Table 5.6 Distribution of
coarse aggregates with
different gradations
Gradation
Small: medium:
big
Type
Size (mm)
1st gradation 1:0:0:0
Small stone
5–20
2nd gradation 5.5:4.5:0:0
Medium stone 20–40
3rd gradation 3:3:4:0
Big stone
40–80
Fig. 5.34 Gradation curves,
reprinted from Wu et al.
(2019), copyright 2020, with
permission from Elsevier
0.0 0.1 0.2 0.3 0.4 0.5 0.6 0.7 0.8 0.9 1.0
0
10
20
30
40
50
60
70
80
90
100
F (%)
d a /d a,max
Fuller curve
1
st gradation curve
2
nd gradation curve
3
rd gradation curve