

4.4 Results and Analysis
83
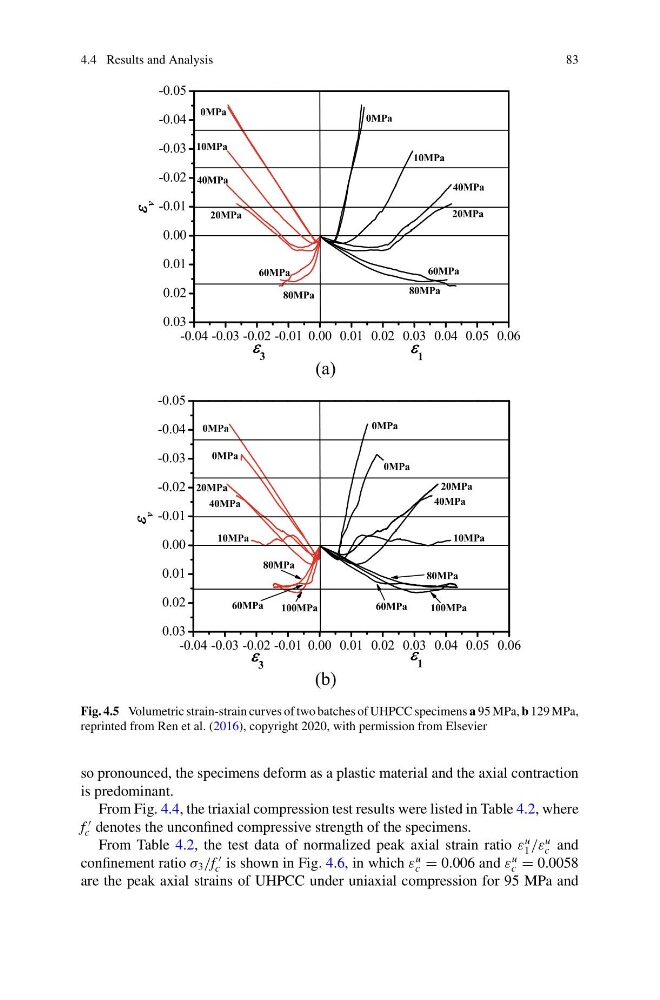
Fig. 4.5 Volumetric strain-strain curves of two batches of UHPCC specimens a 95 MPa, b 129 MPa,
reprinted from Ren et al. (2016), copyright 2020, with permission from Elsevier
so pronounced, the specimens deform as a plastic material and the axial contraction
is predominant.
From Fig. 4.4, the triaxial compression test results were listed in Table 4.2, where
f
c denotes the unconfined compressive strength of the specimens.
From Table 4.2, the test data of normalized peak axial strain ratio ε
u
1 /ε
u
c and
confinement ratio σ 3 /f
c is shown in Fig. 4.6, in which ε
u
c = 0.006 and ε
u
c = 0.0058
are the peak axial strains of UHPCC under uniaxial compression for 95 MPa and
83
Fig. 4.5 Volumetric strain-strain curves of two batches of UHPCC specimens a 95 MPa, b 129 MPa,
reprinted from Ren et al. (2016), copyright 2020, with permission from Elsevier
so pronounced, the specimens deform as a plastic material and the axial contraction
is predominant.
From Fig. 4.4, the triaxial compression test results were listed in Table 4.2, where
f
c denotes the unconfined compressive strength of the specimens.
From Table 4.2, the test data of normalized peak axial strain ratio ε
u
1 /ε
u
c and
confinement ratio σ 3 /f
c is shown in Fig. 4.6, in which ε
u
c = 0.006 and ε
u
c = 0.0058
are the peak axial strains of UHPCC under uniaxial compression for 95 MPa and