

6.6 Chaotic Dynamics of the Size-Dependent Flexible Beams
181
of the power of frequency ω p implies strong change of all vibrational characteristics
(see Figs. 6.11, 6.12a, b). As it happened in other cases, the whole phase portrait
consists of information reported in figure associated with window intervals.
6.6.1.5 The Sheremetev–Pelekh model l/h = 0.3
Table 6.13 presents the characteristics for the time interval t ∈ [300; 5300], whereas
Tables 6.14, 6.15, 6.16 report the results for the chosen windows t ∈ [300; 1100],
t ∈ [1100; 1600] and t ∈ [1600; 5300]. A sequence of the result presentation follows
the sequence of the previous mathematical models.
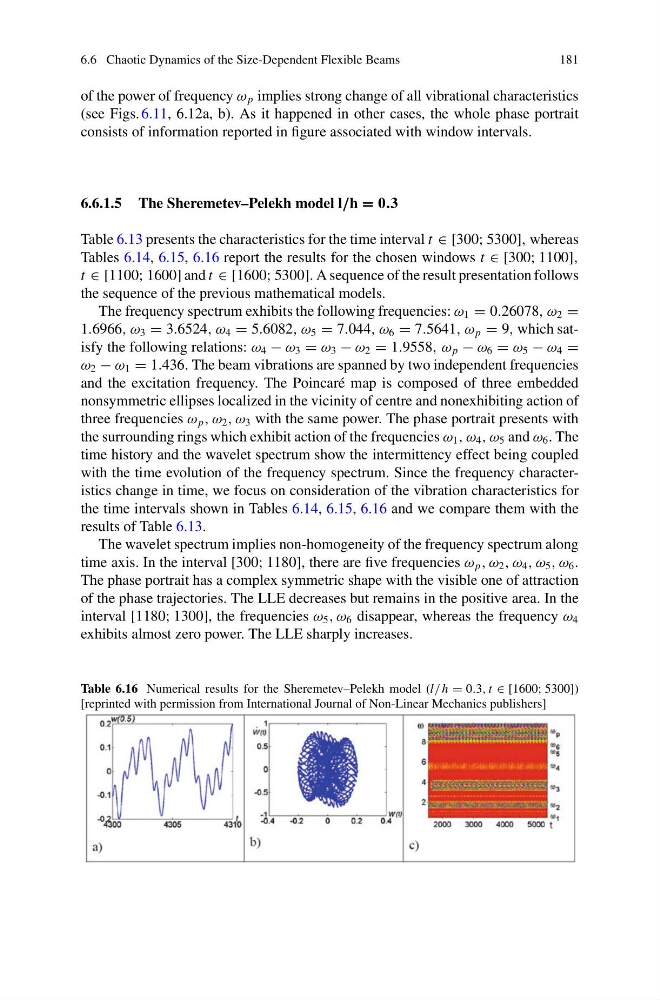
The frequency spectrum exhibits the following frequencies: ω 1 = 0.26078, ω 2 =
1.6966, ω 3 = 3.6524, ω 4 = 5.6082, ω 5 = 7.044, ω 6 = 7.5641, ω p = 9, which satisfy the following relations: ω 4 − ω 3 = ω 3 − ω 2 = 1.9558, ω p − ω 6 = ω 5 − ω 4 =
ω 2 − ω 1 = 1.436. The beam vibrations are spanned by two independent frequencies
and the excitation frequency. The Poincaré map is composed of three embedded
nonsymmetric ellipses localized in the vicinity of centre and nonexhibiting action of
three frequencies ω p , ω 2 , ω 3 with the same power. The phase portrait presents with
the surrounding rings which exhibit action of the frequencies ω 1 , ω 4 , ω 5 and ω 6 . The
time history and the wavelet spectrum show the intermittency effect being coupled
with the time evolution of the frequency spectrum. Since the frequency characteristics change in time, we focus on consideration of the vibration characteristics for
the time intervals shown in Tables 6.14, 6.15, 6.16 and we compare them with the
results of Table 6.13.
The wavelet spectrum implies non-homogeneity of the frequency spectrum along
time axis. In the interval [300; 1180], there are five frequencies ω p , ω 2 , ω 4 , ω 5 , ω 6 .
The phase portrait has a complex symmetric shape with the visible one of attraction
of the phase trajectories. The LLE decreases but remains in the positive area. In the
interval [1180; 1300], the frequencies ω 5 , ω 6 disappear, whereas the frequency ω 4
exhibits almost zero power. The LLE sharply increases.
Table 6.16 Numerical results for the Sheremetev–Pelekh model (l/ h = 0.3, t ∈ [1600; 5300])
[reprinted with permission from International Journal of Non-Linear Mechanics publishers]
181
of the power of frequency ω p implies strong change of all vibrational characteristics
(see Figs. 6.11, 6.12a, b). As it happened in other cases, the whole phase portrait
consists of information reported in figure associated with window intervals.
6.6.1.5 The Sheremetev–Pelekh model l/h = 0.3
Table 6.13 presents the characteristics for the time interval t ∈ [300; 5300], whereas
Tables 6.14, 6.15, 6.16 report the results for the chosen windows t ∈ [300; 1100],
t ∈ [1100; 1600] and t ∈ [1600; 5300]. A sequence of the result presentation follows
the sequence of the previous mathematical models.
The frequency spectrum exhibits the following frequencies: ω 1 = 0.26078, ω 2 =
1.6966, ω 3 = 3.6524, ω 4 = 5.6082, ω 5 = 7.044, ω 6 = 7.5641, ω p = 9, which satisfy the following relations: ω 4 − ω 3 = ω 3 − ω 2 = 1.9558, ω p − ω 6 = ω 5 − ω 4 =
ω 2 − ω 1 = 1.436. The beam vibrations are spanned by two independent frequencies
and the excitation frequency. The Poincaré map is composed of three embedded
nonsymmetric ellipses localized in the vicinity of centre and nonexhibiting action of
three frequencies ω p , ω 2 , ω 3 with the same power. The phase portrait presents with
the surrounding rings which exhibit action of the frequencies ω 1 , ω 4 , ω 5 and ω 6 . The
time history and the wavelet spectrum show the intermittency effect being coupled
with the time evolution of the frequency spectrum. Since the frequency characteristics change in time, we focus on consideration of the vibration characteristics for
the time intervals shown in Tables 6.14, 6.15, 6.16 and we compare them with the
results of Table 6.13.
The wavelet spectrum implies non-homogeneity of the frequency spectrum along
time axis. In the interval [300; 1180], there are five frequencies ω p , ω 2 , ω 4 , ω 5 , ω 6 .
The phase portrait has a complex symmetric shape with the visible one of attraction
of the phase trajectories. The LLE decreases but remains in the positive area. In the
interval [1180; 1300], the frequencies ω 5 , ω 6 disappear, whereas the frequency ω 4
exhibits almost zero power. The LLE sharply increases.
Table 6.16 Numerical results for the Sheremetev–Pelekh model (l/ h = 0.3, t ∈ [1600; 5300])
[reprinted with permission from International Journal of Non-Linear Mechanics publishers]