

174
6 Mathematical Models of Micro- and Nano-cylindrical Panels in Temperature Field
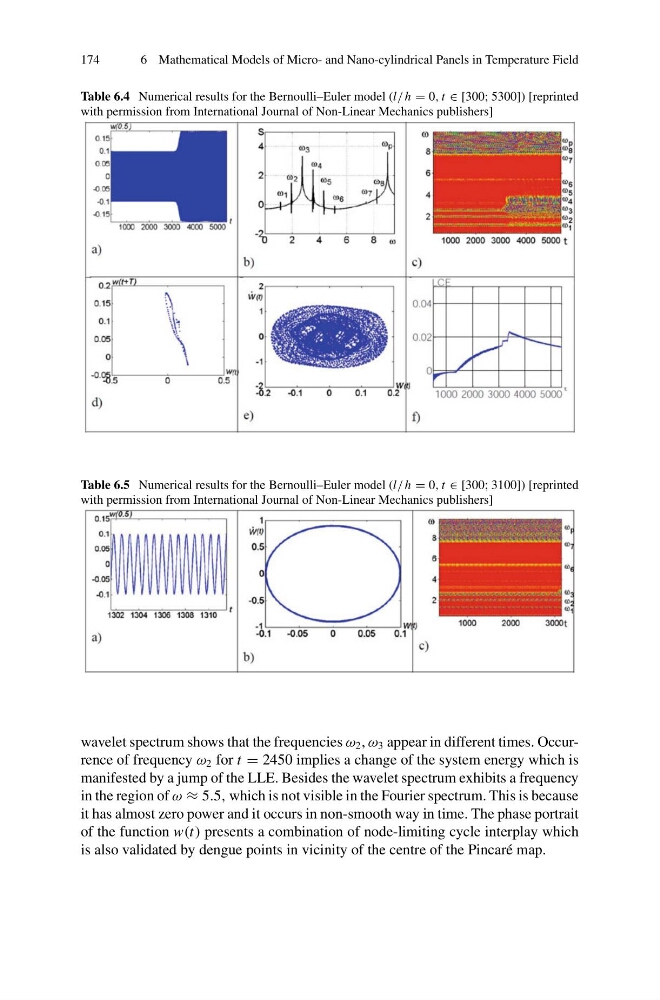
Table 6.4 Numerical results for the Bernoulli–Euler model (l/ h = 0, t ∈ [300; 5300]) [reprinted
with permission from International Journal of Non-Linear Mechanics publishers]
Table 6.5 Numerical results for the Bernoulli–Euler model (l/ h = 0, t ∈ [300; 3100]) [reprinted
with permission from International Journal of Non-Linear Mechanics publishers]
wavelet spectrum shows that the frequencies ω 2 , ω 3 appear in different times. Occurrence of frequency ω 2 for t = 2450 implies a change of the system energy which is
manifested by a jump of the LLE. Besides the wavelet spectrum exhibits a frequency
in the region of ω ≈ 5.5, which is not visible in the Fourier spectrum. This is because
it has almost zero power and it occurs in non-smooth way in time. The phase portrait
of the function w(t) presents a combination of node-limiting cycle interplay which
is also validated by dengue points in vicinity of the centre of the Pincaré map.
6 Mathematical Models of Micro- and Nano-cylindrical Panels in Temperature Field
Table 6.4 Numerical results for the Bernoulli–Euler model (l/ h = 0, t ∈ [300; 5300]) [reprinted
with permission from International Journal of Non-Linear Mechanics publishers]
Table 6.5 Numerical results for the Bernoulli–Euler model (l/ h = 0, t ∈ [300; 3100]) [reprinted
with permission from International Journal of Non-Linear Mechanics publishers]
wavelet spectrum shows that the frequencies ω 2 , ω 3 appear in different times. Occurrence of frequency ω 2 for t = 2450 implies a change of the system energy which is
manifested by a jump of the LLE. Besides the wavelet spectrum exhibits a frequency
in the region of ω ≈ 5.5, which is not visible in the Fourier spectrum. This is because
it has almost zero power and it occurs in non-smooth way in time. The phase portrait
of the function w(t) presents a combination of node-limiting cycle interplay which
is also validated by dengue points in vicinity of the centre of the Pincaré map.