

150
P. Jain and L. Varghese
In this equations for y i and x i are: where y i = y for i sample in (v), x i = x for i
sample in Eq. (3) and f (t) for i sample is calculated from median ranks (M.R.) and
construct a table as per respective figure and calculate β and η with the help of Eqs.
(4)–(9) and calculate N, t, x = ln(t), F(t), y, x
2 , y
2 , x * y.
6. After calculating the parameter, we find the reliability at the point of average time
to failure for selected car system. The aim of using the traditional technique for
car maintenance is to calculate reliability function of time R(t) of car subsystem.
For calculating the reliability function R(t) for each subsystem, the collected
data were converted from average distance to failure to average time to failure
by assuming the sample-A cars travelled the distance by average speed 60 km/h.
This is because the reliability function which was used in this study is a function
of time, where the reliability decreases as time increases.
7. Assuming the time and compare the reliability at this time for the samples
subsystem and find which is more reliable system of Wagon-R.
The limitations of the study include no cost analysis were performed as this study
mainly focused to identify the failure sequence of automotive subsystem.
3 Results and Discussions
3.1 Clutch System
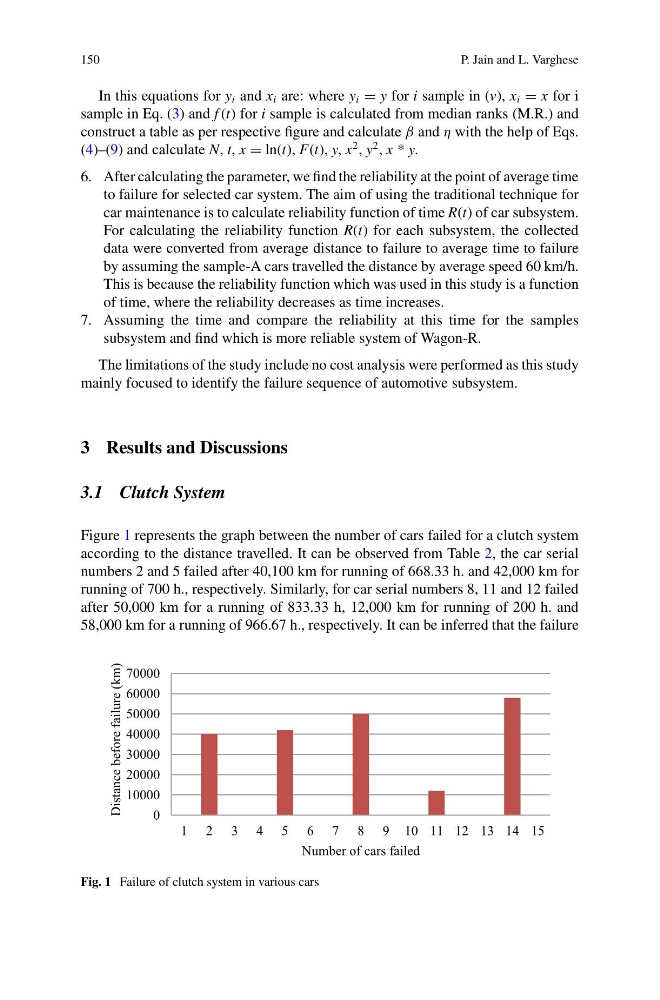
Figure 1 represents the graph between the number of cars failed for a clutch system
according to the distance travelled. It can be observed from Table 2, the car serial
numbers 2 and 5 failed after 40,100 km for running of 668.33 h. and 42,000 km for
running of 700 h., respectively. Similarly, for car serial numbers 8, 11 and 12 failed
after 50,000 km for a running of 833.33 h, 12,000 km for running of 200 h. and
58,000 km for a running of 966.67 h., respectively. It can be inferred that the failure
0
10000
20000
30000
40000
50000
60000
70000
1 2 3 4 5 6 7 8 9 10 11 12 13 14 15
Distance before failure (km)
Number of cars failed
Fig. 1 Failure of clutch system in various cars
P. Jain and L. Varghese
In this equations for y i and x i are: where y i = y for i sample in (v), x i = x for i
sample in Eq. (3) and f (t) for i sample is calculated from median ranks (M.R.) and
construct a table as per respective figure and calculate β and η with the help of Eqs.
(4)–(9) and calculate N, t, x = ln(t), F(t), y, x
2 , y
2 , x * y.
6. After calculating the parameter, we find the reliability at the point of average time
to failure for selected car system. The aim of using the traditional technique for
car maintenance is to calculate reliability function of time R(t) of car subsystem.
For calculating the reliability function R(t) for each subsystem, the collected
data were converted from average distance to failure to average time to failure
by assuming the sample-A cars travelled the distance by average speed 60 km/h.
This is because the reliability function which was used in this study is a function
of time, where the reliability decreases as time increases.
7. Assuming the time and compare the reliability at this time for the samples
subsystem and find which is more reliable system of Wagon-R.
The limitations of the study include no cost analysis were performed as this study
mainly focused to identify the failure sequence of automotive subsystem.
3 Results and Discussions
3.1 Clutch System
Figure 1 represents the graph between the number of cars failed for a clutch system
according to the distance travelled. It can be observed from Table 2, the car serial
numbers 2 and 5 failed after 40,100 km for running of 668.33 h. and 42,000 km for
running of 700 h., respectively. Similarly, for car serial numbers 8, 11 and 12 failed
after 50,000 km for a running of 833.33 h, 12,000 km for running of 200 h. and
58,000 km for a running of 966.67 h., respectively. It can be inferred that the failure
0
10000
20000
30000
40000
50000
60000
70000
1 2 3 4 5 6 7 8 9 10 11 12 13 14 15
Distance before failure (km)
Number of cars failed
Fig. 1 Failure of clutch system in various cars