

100
A. Petare et al.
used to calculate change in max. surface roughness ‘R max ’:
R max = Avg. R max of a gear before AFF - Avg. R max
of the same gear after AFF(µm)
(1)
Also, change in average surface roughness ‘R a ’ was calculated.
2.4.2 Surface Morphology Examination
Surface morphology of flank surface was examined for before finished and AFF fine
finished straight bevel gears using optical microscope (Leica DM2500M from Leica
Microsystems, Germany) to assess the finishing mechanism by AFF process.
3 Result and Analysis
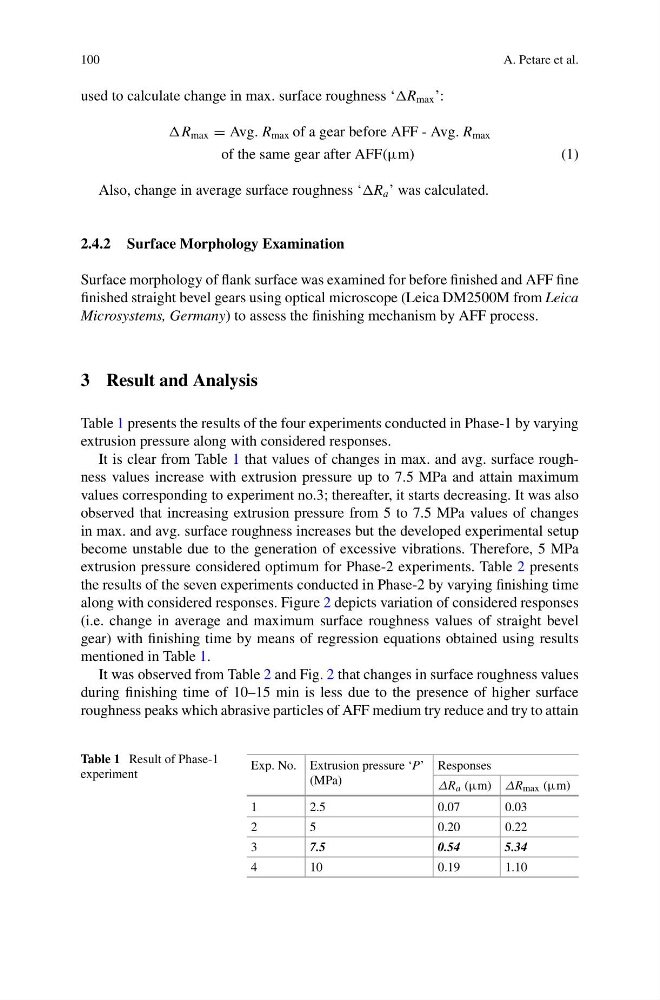
Table 1 presents the results of the four experiments conducted in Phase-1 by varying
extrusion pressure along with considered responses.
It is clear from Table 1 that values of changes in max. and avg. surface roughness values increase with extrusion pressure up to 7.5 MPa and attain maximum
values corresponding to experiment no.3; thereafter, it starts decreasing. It was also
observed that increasing extrusion pressure from 5 to 7.5 MPa values of changes
in max. and avg. surface roughness increases but the developed experimental setup
become unstable due to the generation of excessive vibrations. Therefore, 5 MPa
extrusion pressure considered optimum for Phase-2 experiments. Table 2 presents
the results of the seven experiments conducted in Phase-2 by varying finishing time
along with considered responses. Figure 2 depicts variation of considered responses
(i.e. change in average and maximum surface roughness values of straight bevel
gear) with finishing time by means of regression equations obtained using results
mentioned in Table 1.
It was observed from Table 2 and Fig. 2 that changes in surface roughness values
during finishing time of 10–15 min is less due to the presence of higher surface
roughness peaks which abrasive particles of AFF medium try reduce and try to attain
Table 1 Result of Phase-1
experiment
Exp. No. Extrusion pressure ‘P’
(MPa)
Responses
ΔR a (µm) ΔR max (µm)
1
2.5
0.07
0.03
2
5
0.20
0.22
3
7.5
0.54
5.34
4
10
0.19
1.10
A. Petare et al.
used to calculate change in max. surface roughness ‘R max ’:
R max = Avg. R max of a gear before AFF - Avg. R max
of the same gear after AFF(µm)
(1)
Also, change in average surface roughness ‘R a ’ was calculated.
2.4.2 Surface Morphology Examination
Surface morphology of flank surface was examined for before finished and AFF fine
finished straight bevel gears using optical microscope (Leica DM2500M from Leica
Microsystems, Germany) to assess the finishing mechanism by AFF process.
3 Result and Analysis
Table 1 presents the results of the four experiments conducted in Phase-1 by varying
extrusion pressure along with considered responses.
It is clear from Table 1 that values of changes in max. and avg. surface roughness values increase with extrusion pressure up to 7.5 MPa and attain maximum
values corresponding to experiment no.3; thereafter, it starts decreasing. It was also
observed that increasing extrusion pressure from 5 to 7.5 MPa values of changes
in max. and avg. surface roughness increases but the developed experimental setup
become unstable due to the generation of excessive vibrations. Therefore, 5 MPa
extrusion pressure considered optimum for Phase-2 experiments. Table 2 presents
the results of the seven experiments conducted in Phase-2 by varying finishing time
along with considered responses. Figure 2 depicts variation of considered responses
(i.e. change in average and maximum surface roughness values of straight bevel
gear) with finishing time by means of regression equations obtained using results
mentioned in Table 1.
It was observed from Table 2 and Fig. 2 that changes in surface roughness values
during finishing time of 10–15 min is less due to the presence of higher surface
roughness peaks which abrasive particles of AFF medium try reduce and try to attain
Table 1 Result of Phase-1
experiment
Exp. No. Extrusion pressure ‘P’
(MPa)
Responses
ΔR a (µm) ΔR max (µm)
1
2.5
0.07
0.03
2
5
0.20
0.22
3
7.5
0.54
5.34
4
10
0.19
1.10