

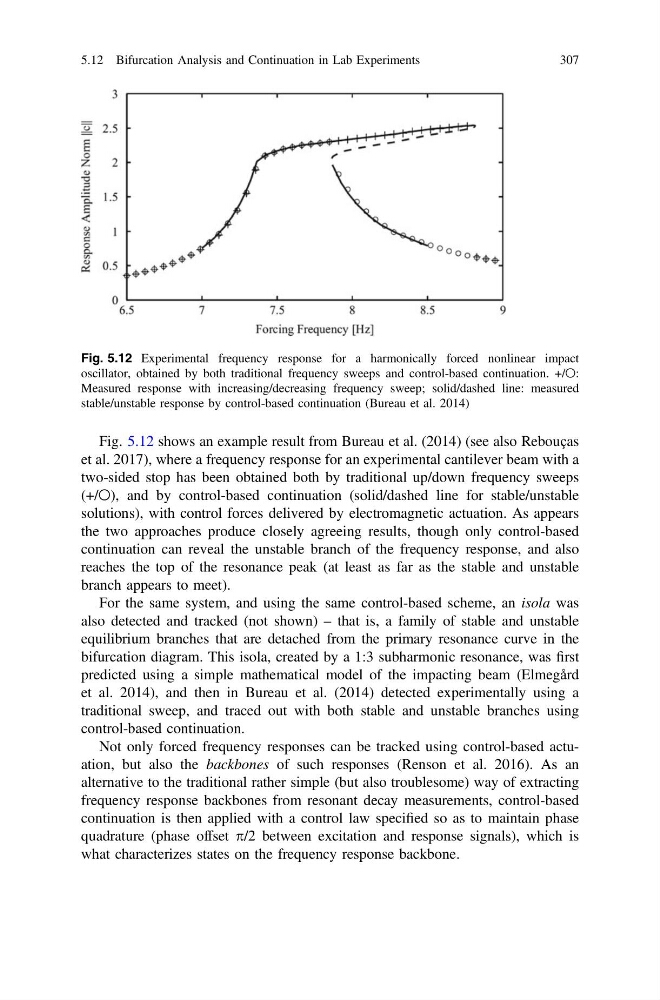
Fig. 5.12 shows an example result from Bureau et al. (2014) (see also Rebouças
et al. 2017), where a frequency response for an experimental cantilever beam with a
two-sided stop has been obtained both by traditional up/down frequency sweeps
(+/○), and by control-based continuation (solid/dashed line for stable/unstable
solutions), with control forces delivered by electromagnetic actuation. As appears
the two approaches produce closely agreeing results, though only control-based
continuation can reveal the unstable branch of the frequency response, and also
reaches the top of the resonance peak (at least as far as the stable and unstable
branch appears to meet).
For the same system, and using the same control-based scheme, an isola was
also detected and tracked (not shown) – that is, a family of stable and unstable
equilibrium branches that are detached from the primary resonance curve in the
bifurcation diagram. This isola, created by a 1:3 subharmonic resonance, was first
predicted using a simple mathematical model of the impacting beam (Elmegård
et al. 2014), and then in Bureau et al. (2014) detected experimentally using a
traditional sweep, and traced out with both stable and unstable branches using
control-based continuation.
Not only forced frequency responses can be tracked using control-based actuation, but also the backbones of such responses (Renson et al. 2016). As an
alternative to the traditional rather simple (but also troublesome) way of extracting
frequency response backbones from resonant decay measurements, control-based
continuation is then applied with a control law specified so as to maintain phase
quadrature (phase offset p/2 between excitation and response signals), which is
what characterizes states on the frequency response backbone.
Fig. 5.12 Experimental frequency response for a harmonically forced nonlinear impact
oscillator, obtained by both traditional frequency sweeps and control-based continuation. +/○:
Measured response with increasing/decreasing frequency sweep; solid/dashed line: measured
stable/unstable response by control-based continuation (Bureau et al. 2014)
5.12 Bifurcation Analysis and Continuation in Lab Experiments
307
et al. 2017), where a frequency response for an experimental cantilever beam with a
two-sided stop has been obtained both by traditional up/down frequency sweeps
(+/○), and by control-based continuation (solid/dashed line for stable/unstable
solutions), with control forces delivered by electromagnetic actuation. As appears
the two approaches produce closely agreeing results, though only control-based
continuation can reveal the unstable branch of the frequency response, and also
reaches the top of the resonance peak (at least as far as the stable and unstable
branch appears to meet).
For the same system, and using the same control-based scheme, an isola was
also detected and tracked (not shown) – that is, a family of stable and unstable
equilibrium branches that are detached from the primary resonance curve in the
bifurcation diagram. This isola, created by a 1:3 subharmonic resonance, was first
predicted using a simple mathematical model of the impacting beam (Elmegård
et al. 2014), and then in Bureau et al. (2014) detected experimentally using a
traditional sweep, and traced out with both stable and unstable branches using
control-based continuation.
Not only forced frequency responses can be tracked using control-based actuation, but also the backbones of such responses (Renson et al. 2016). As an
alternative to the traditional rather simple (but also troublesome) way of extracting
frequency response backbones from resonant decay measurements, control-based
continuation is then applied with a control law specified so as to maintain phase
quadrature (phase offset p/2 between excitation and response signals), which is
what characterizes states on the frequency response backbone.
Fig. 5.12 Experimental frequency response for a harmonically forced nonlinear impact
oscillator, obtained by both traditional frequency sweeps and control-based continuation. +/○:
Measured response with increasing/decreasing frequency sweep; solid/dashed line: measured
stable/unstable response by control-based continuation (Bureau et al. 2014)
5.12 Bifurcation Analysis and Continuation in Lab Experiments
307