

63
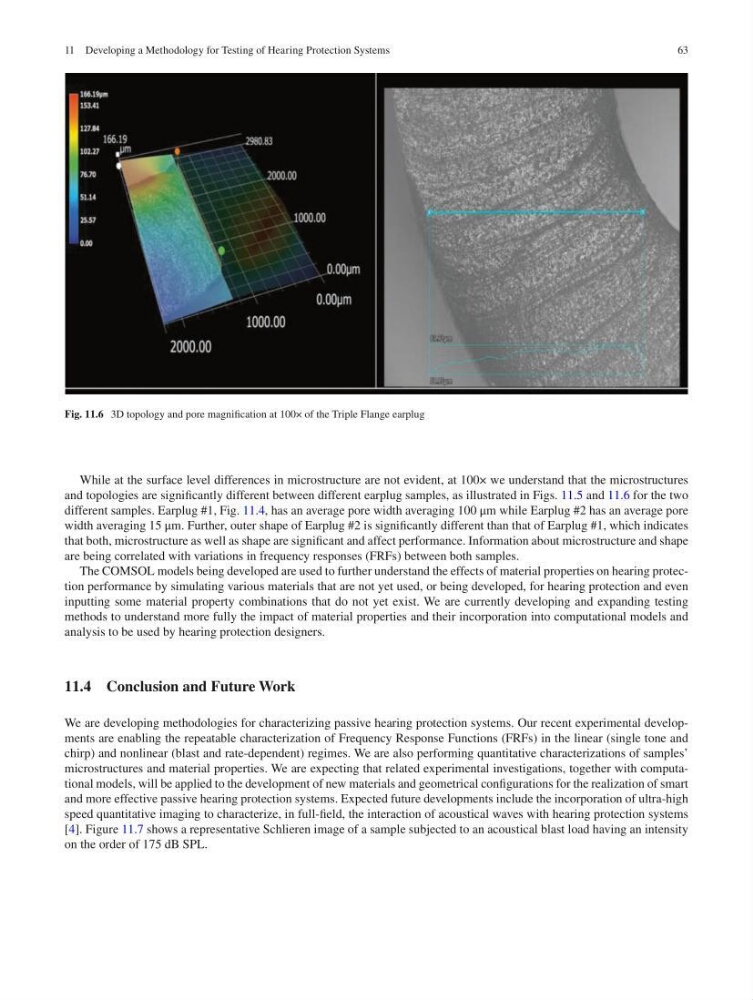
Fig. 11.6 3D topology and pore magnification at 100× of the Triple Flange earplug
While at the surface level differences in microstructure are not evident, at 100× we understand that the microstructures
and topologies are significantly different between different earplug samples, as illustrated in Figs. 11.5 and 11.6 for the two
different samples. Earplug #1, Fig. 11.4, has an average pore width averaging 100 μm while Earplug #2 has an average pore
width averaging 15 μm. Further, outer shape of Earplug #2 is significantly different than that of Earplug #1, which indicates
that both, microstructure as well as shape are significant and affect performance. Information about microstructure and shape
are being correlated with variations in frequency responses (FRFs) between both samples.
The COMSOL models being developed are used to further understand the effects of material properties on hearing protection performance by simulating various materials that are not yet used, or being developed, for hearing protection and even
inputting some material property combinations that do not yet exist. We are currently developing and expanding testing
methods to understand more fully the impact of material properties and their incorporation into computational models and
analysis to be used by hearing protection designers.
11.4 Conclusion and Future Work
We are developing methodologies for characterizing passive hearing protection systems. Our recent experimental developments are enabling the repeatable characterization of Frequency Response Functions (FRFs) in the linear (single tone and
chirp) and nonlinear (blast and rate-dependent) regimes. We are also performing quantitative characterizations of samples’
microstructures and material properties. We are expecting that related experimental investigations, together with computational models, will be applied to the development of new materials and geometrical configurations for the realization of smart
and more effective passive hearing protection systems. Expected future developments include the incorporation of ultra-high
speed quantitative imaging to characterize, in full-field, the interaction of acoustical waves with hearing protection systems
[4]. Figure 11.7 shows a representative Schlieren image of a sample subjected to an acoustical blast load having an intensity
on the order of 175 dB SPL.
11 Developing a Methodology for Testing of Hearing Protection Systems
Fig. 11.6 3D topology and pore magnification at 100× of the Triple Flange earplug
While at the surface level differences in microstructure are not evident, at 100× we understand that the microstructures
and topologies are significantly different between different earplug samples, as illustrated in Figs. 11.5 and 11.6 for the two
different samples. Earplug #1, Fig. 11.4, has an average pore width averaging 100 μm while Earplug #2 has an average pore
width averaging 15 μm. Further, outer shape of Earplug #2 is significantly different than that of Earplug #1, which indicates
that both, microstructure as well as shape are significant and affect performance. Information about microstructure and shape
are being correlated with variations in frequency responses (FRFs) between both samples.
The COMSOL models being developed are used to further understand the effects of material properties on hearing protection performance by simulating various materials that are not yet used, or being developed, for hearing protection and even
inputting some material property combinations that do not yet exist. We are currently developing and expanding testing
methods to understand more fully the impact of material properties and their incorporation into computational models and
analysis to be used by hearing protection designers.
11.4 Conclusion and Future Work
We are developing methodologies for characterizing passive hearing protection systems. Our recent experimental developments are enabling the repeatable characterization of Frequency Response Functions (FRFs) in the linear (single tone and
chirp) and nonlinear (blast and rate-dependent) regimes. We are also performing quantitative characterizations of samples’
microstructures and material properties. We are expecting that related experimental investigations, together with computational models, will be applied to the development of new materials and geometrical configurations for the realization of smart
and more effective passive hearing protection systems. Expected future developments include the incorporation of ultra-high
speed quantitative imaging to characterize, in full-field, the interaction of acoustical waves with hearing protection systems
[4]. Figure 11.7 shows a representative Schlieren image of a sample subjected to an acoustical blast load having an intensity
on the order of 175 dB SPL.
11 Developing a Methodology for Testing of Hearing Protection Systems