

46
8.2 Material Preparation
Both soft polyacrylamide (PA) and agarose hydrogels were tested in our inertial microcavitation rheology (IMR) experiments. Soft PA samples were prepared from 40.0% acrylamide solution and 2.0% bis solution (Bio-Rad, Hercules, CA)
mixed to a final concentration of 3.0%/0.2% Acrylamide/Bis (v/v) in deionized water and crosslinked with 0.5% APS
(ThermoFisher Scientific, USA) and 1.25% TEMED (ThermoFisher Scientific, USA). Once mixed, PA samples were allowed
to polymerize in custom, 15 mm diameter by 2 mm height cylindrical Delrin molds for 1 h, followed by complete submersion
in deionized water for 24 h before testing to allow for any swelling to equilibrate.
Agarose samples at 0.5%, 1.0%, 2.5%, and 5.0% (w/v) samples were cast into 15 mm cylindrical samples with a height
of 2 mm. Agarose powder was diluted in 0.9% NaCl solution in deionized water to the desired concentration. Solutions were
then heated in a convection oven to 90 °C until the agarose powder was fully dissolved, stirring occasionally. The resultant
mixture was weighed following heating and any mass loss due to evaporation was recovered through the addition of deionized water to recover the initial weight. Agarose was then poured into 15 mm (diameter) × 2 mm (height) Delrin molds and
allowed to cool to room temperature. Samples were removed from the molds and submerged overnight in deionized water to
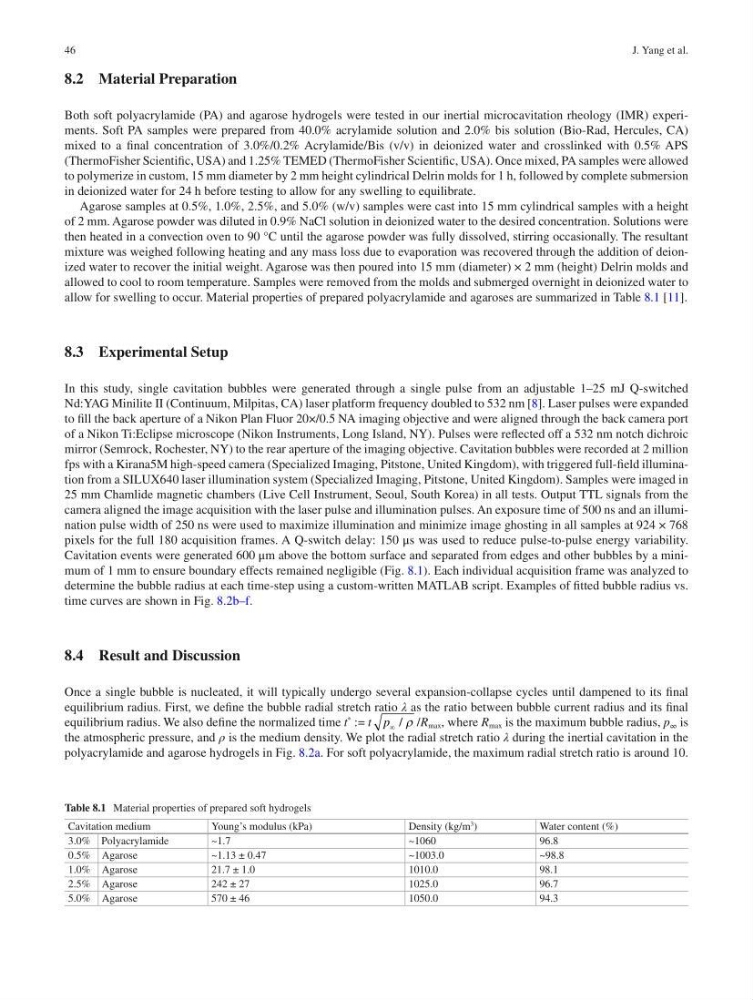
allow for swelling to occur. Material properties of prepared polyacrylamide and agaroses are summarized in Table 8.1 [11].
8.3 Experimental Setup
In this study, single cavitation bubbles were generated through a single pulse from an adjustable 1–25 mJ Q-switched
Nd:YAG Minilite II (Continuum, Milpitas, CA) laser platform frequency doubled to 532 nm [8]. Laser pulses were expanded
to fill the back aperture of a Nikon Plan Fluor 20×/0.5 NA imaging objective and were aligned through the back camera port
of a Nikon Ti:Eclipse microscope (Nikon Instruments, Long Island, NY). Pulses were reflected off a 532 nm notch dichroic
mirror (Semrock, Rochester, NY) to the rear aperture of the imaging objective. Cavitation bubbles were recorded at 2 million
fps with a Kirana5M high-speed camera (Specialized Imaging, Pitstone, United Kingdom), with triggered full-field illumination from a SILUX640 laser illumination system (Specialized Imaging, Pitstone, United Kingdom). Samples were imaged in
25 mm Chamlide magnetic chambers (Live Cell Instrument, Seoul, South Korea) in all tests. Output TTL signals from the
camera aligned the image acquisition with the laser pulse and illumination pulses. An exposure time of 500 ns and an illumination pulse width of 250 ns were used to maximize illumination and minimize image ghosting in all samples at 924 × 768
pixels for the full 180 acquisition frames. A Q-switch delay: 150 μs was used to reduce pulse- to- pulse energy variability.
Cavitation events were generated 600 μm above the bottom surface and separated from edges and other bubbles by a minimum of 1 mm to ensure boundary effects remained negligible (Fig. 8.1). Each individual acquisition frame was analyzed to
determine the bubble radius at each time-step using a custom-written MATLAB script. Examples of fitted bubble radius vs.
time curves are shown in Fig. 8.2b–f.
8.4 Result and Discussion
Once a single bubble is nucleated, it will typically undergo several expansion-collapse cycles until dampened to its final
equilibrium radius. First, we define the bubble radial stretch ratio λ as the ratio between bubble current radius and its final
equilibrium radius. We also define the normalized time t
*
:= t p ¥ / r /R max , where R max is the maximum bubble radius, p ∞ is
the atmospheric pressure, and ρ is the medium density. We plot the radial stretch ratio λ during the inertial cavitation in the
polyacrylamide and agarose hydrogels in Fig. 8.2a. For soft polyacrylamide, the maximum radial stretch ratio is around 10.
Table 8.1 Material properties of prepared soft hydrogels
Cavitation medium
Young’s modulus (kPa)
Density (kg/m
3
)
Water content (%)
3.0% Polyacrylamide
~1.7
~1060
96.8
0.5% Agarose
~1.13 ± 0.47
~1003.0
~98.8
1.0% Agarose
21.7 ± 1.0
1010.0
98.1
2.5% Agarose
242 ± 27
1025.0
96.7
5.0% Agarose
570 ± 46
1050.0
94.3
J. Yang et al.
8.2 Material Preparation
Both soft polyacrylamide (PA) and agarose hydrogels were tested in our inertial microcavitation rheology (IMR) experiments. Soft PA samples were prepared from 40.0% acrylamide solution and 2.0% bis solution (Bio-Rad, Hercules, CA)
mixed to a final concentration of 3.0%/0.2% Acrylamide/Bis (v/v) in deionized water and crosslinked with 0.5% APS
(ThermoFisher Scientific, USA) and 1.25% TEMED (ThermoFisher Scientific, USA). Once mixed, PA samples were allowed
to polymerize in custom, 15 mm diameter by 2 mm height cylindrical Delrin molds for 1 h, followed by complete submersion
in deionized water for 24 h before testing to allow for any swelling to equilibrate.
Agarose samples at 0.5%, 1.0%, 2.5%, and 5.0% (w/v) samples were cast into 15 mm cylindrical samples with a height
of 2 mm. Agarose powder was diluted in 0.9% NaCl solution in deionized water to the desired concentration. Solutions were
then heated in a convection oven to 90 °C until the agarose powder was fully dissolved, stirring occasionally. The resultant
mixture was weighed following heating and any mass loss due to evaporation was recovered through the addition of deionized water to recover the initial weight. Agarose was then poured into 15 mm (diameter) × 2 mm (height) Delrin molds and
allowed to cool to room temperature. Samples were removed from the molds and submerged overnight in deionized water to
allow for swelling to occur. Material properties of prepared polyacrylamide and agaroses are summarized in Table 8.1 [11].
8.3 Experimental Setup
In this study, single cavitation bubbles were generated through a single pulse from an adjustable 1–25 mJ Q-switched
Nd:YAG Minilite II (Continuum, Milpitas, CA) laser platform frequency doubled to 532 nm [8]. Laser pulses were expanded
to fill the back aperture of a Nikon Plan Fluor 20×/0.5 NA imaging objective and were aligned through the back camera port
of a Nikon Ti:Eclipse microscope (Nikon Instruments, Long Island, NY). Pulses were reflected off a 532 nm notch dichroic
mirror (Semrock, Rochester, NY) to the rear aperture of the imaging objective. Cavitation bubbles were recorded at 2 million
fps with a Kirana5M high-speed camera (Specialized Imaging, Pitstone, United Kingdom), with triggered full-field illumination from a SILUX640 laser illumination system (Specialized Imaging, Pitstone, United Kingdom). Samples were imaged in
25 mm Chamlide magnetic chambers (Live Cell Instrument, Seoul, South Korea) in all tests. Output TTL signals from the
camera aligned the image acquisition with the laser pulse and illumination pulses. An exposure time of 500 ns and an illumination pulse width of 250 ns were used to maximize illumination and minimize image ghosting in all samples at 924 × 768
pixels for the full 180 acquisition frames. A Q-switch delay: 150 μs was used to reduce pulse- to- pulse energy variability.
Cavitation events were generated 600 μm above the bottom surface and separated from edges and other bubbles by a minimum of 1 mm to ensure boundary effects remained negligible (Fig. 8.1). Each individual acquisition frame was analyzed to
determine the bubble radius at each time-step using a custom-written MATLAB script. Examples of fitted bubble radius vs.
time curves are shown in Fig. 8.2b–f.
8.4 Result and Discussion
Once a single bubble is nucleated, it will typically undergo several expansion-collapse cycles until dampened to its final
equilibrium radius. First, we define the bubble radial stretch ratio λ as the ratio between bubble current radius and its final
equilibrium radius. We also define the normalized time t
*
:= t p ¥ / r /R max , where R max is the maximum bubble radius, p ∞ is
the atmospheric pressure, and ρ is the medium density. We plot the radial stretch ratio λ during the inertial cavitation in the
polyacrylamide and agarose hydrogels in Fig. 8.2a. For soft polyacrylamide, the maximum radial stretch ratio is around 10.
Table 8.1 Material properties of prepared soft hydrogels
Cavitation medium
Young’s modulus (kPa)
Density (kg/m
3
)
Water content (%)
3.0% Polyacrylamide
~1.7
~1060
96.8
0.5% Agarose
~1.13 ± 0.47
~1003.0
~98.8
1.0% Agarose
21.7 ± 1.0
1010.0
98.1
2.5% Agarose
242 ± 27
1025.0
96.7
5.0% Agarose
570 ± 46
1050.0
94.3
J. Yang et al.