

26
5.3 Finite Elements Simulations of the Tests
Since in this study the specimen aspect ratio (length/width) is small, finite elements simulations are used to determine the
local stress state in off-axis specimens. Linear elastic FE simulations do not reproduce the experimental observations. So the
introduction of the end-constrain is not sufficient to explain this phenomenon. Since it is known that CFRP is time-dependent
material and there is no clear damage mechanism to consider in UD composites, a viscoelastic model is considered. The
considered model is a viscoelastic spectral model taken from Maire [3]. The parameters of the model have been identified by
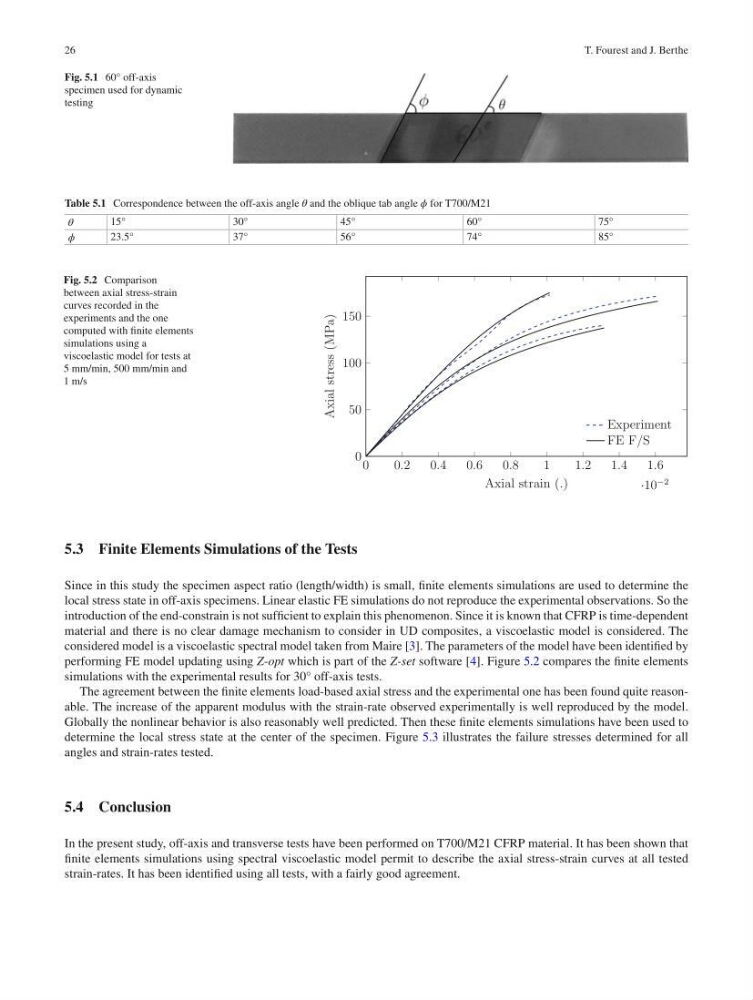
performing FE model updating using Z-opt which is part of the Z-set software [4]. Figure 5.2 compares the finite elements
simulations with the experimental results for 30° off-axis tests.
The agreement between the finite elements load-based axial stress and the experimental one has been found quite reasonable. The increase of the apparent modulus with the strain-rate observed experimentally is well reproduced by the model.
Globally the nonlinear behavior is also reasonably well predicted. Then these finite elements simulations have been used to
determine the local stress state at the center of the specimen. Figure 5.3 illustrates the failure stresses determined for all
angles and strain-rates tested.
5.4 Conclusion
In the present study, off-axis and transverse tests have been performed on T700/M21 CFRP material. It has been shown that
finite elements simulations using spectral viscoelastic model permit to describe the axial stress-strain curves at all tested
strain-rates. It has been identified using all tests, with a fairly good agreement.
Fig. 5.1 60° off-axis
specimen used for dynamic
testing
0
0.2
0.4
0.6
0.8
1
1.2
1.4
1.6
·10
−2
0
50
100
150
Axial strain (.)
Axial stress (MPa)
Experiment
FE F/S
Fig. 5.2 Comparison
between axial stress-strain
curves recorded in the
experiments and the one
computed with finite elements
simulations using a
viscoelastic model for tests at
5 mm/min, 500 mm/min and
1 m/s
Table 5.1 Correspondence between the off-axis angle θ and the oblique tab angle ϕ for T700/M21
θ
15°
30°
45°
60°
75°
ϕ
23.5°
37°
56°
74°
85°
T. Fourest and J. Berthe
5.3 Finite Elements Simulations of the Tests
Since in this study the specimen aspect ratio (length/width) is small, finite elements simulations are used to determine the
local stress state in off-axis specimens. Linear elastic FE simulations do not reproduce the experimental observations. So the
introduction of the end-constrain is not sufficient to explain this phenomenon. Since it is known that CFRP is time-dependent
material and there is no clear damage mechanism to consider in UD composites, a viscoelastic model is considered. The
considered model is a viscoelastic spectral model taken from Maire [3]. The parameters of the model have been identified by
performing FE model updating using Z-opt which is part of the Z-set software [4]. Figure 5.2 compares the finite elements
simulations with the experimental results for 30° off-axis tests.
The agreement between the finite elements load-based axial stress and the experimental one has been found quite reasonable. The increase of the apparent modulus with the strain-rate observed experimentally is well reproduced by the model.
Globally the nonlinear behavior is also reasonably well predicted. Then these finite elements simulations have been used to
determine the local stress state at the center of the specimen. Figure 5.3 illustrates the failure stresses determined for all
angles and strain-rates tested.
5.4 Conclusion
In the present study, off-axis and transverse tests have been performed on T700/M21 CFRP material. It has been shown that
finite elements simulations using spectral viscoelastic model permit to describe the axial stress-strain curves at all tested
strain-rates. It has been identified using all tests, with a fairly good agreement.
Fig. 5.1 60° off-axis
specimen used for dynamic
testing
0
0.2
0.4
0.6
0.8
1
1.2
1.4
1.6
·10
−2
0
50
100
150
Axial strain (.)
Axial stress (MPa)
Experiment
FE F/S
Fig. 5.2 Comparison
between axial stress-strain
curves recorded in the
experiments and the one
computed with finite elements
simulations using a
viscoelastic model for tests at
5 mm/min, 500 mm/min and
1 m/s
Table 5.1 Correspondence between the off-axis angle θ and the oblique tab angle ϕ for T700/M21
θ
15°
30°
45°
60°
75°
ϕ
23.5°
37°
56°
74°
85°
T. Fourest and J. Berthe