

3
MTS tests and short specimens (Fig. 1.1b) were used for Drop-Hopkinson bar tests in this study. The fast MTS was used to
cover the lower portion of the intermediate strain rate regime and the higher portion was covered with a Drop-Hopkinson bar.
A Phantom camera system was synchronized with the fast MTS for in situ specimen deformation measurement over the gage
section. A dynamic load washer was used to measure the force during the fast MTS tests. The procedure of the DropHopkinson bar tests was presented in [5]. A high-speed laser extensometer was employed to accurately track the in situ
motion of the incident and transmission bar ends independently with a split beam of a line laser into two separate high-speed
photodetectors [6]. It is noted that the specimen deformation over the gage section was corrected from the high-speed laser
extensometer measurement [7].
High-strain-rate tensile tests were conducted with a Kolsky tension bar. The stress history of the sample is therefore
obtained using the transmitted strain signal [8]. The same high-speed laser extensometer and posttest correction method were
applied to calculate specimen strain over the gage section.
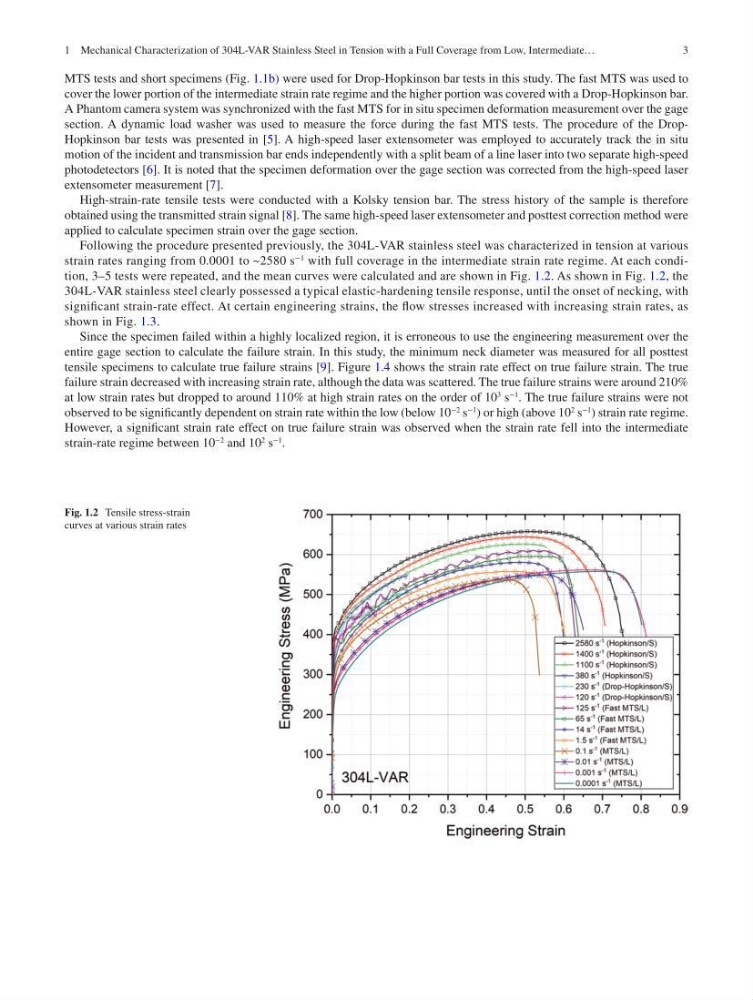
Following the procedure presented previously, the 304L- VAR stainless steel was characterized in tension at various
strain rates ranging from 0.0001 to ~2580 s
−1
with full coverage in the intermediate strain rate regime. At each condition, 3–5 tests were repeated, and the mean curves were calculated and are shown in Fig. 1.2. As shown in Fig. 1.2, the
304L- VAR stainless steel clearly possessed a typical elastic- hardening tensile response, until the onset of necking, with
significant strain-rate effect. At certain engineering strains, the flow stresses increased with increasing strain rates, as
shown in Fig. 1.3.
Since the specimen failed within a highly localized region, it is erroneous to use the engineering measurement over the
entire gage section to calculate the failure strain. In this study, the minimum neck diameter was measured for all posttest
tensile specimens to calculate true failure strains [9]. Figure 1.4 shows the strain rate effect on true failure strain. The true
failure strain decreased with increasing strain rate, although the data was scattered. The true failure strains were around 210%
at low strain rates but dropped to around 110% at high strain rates on the order of 10
3
s
−1
. The true failure strains were not
observed to be significantly dependent on strain rate within the low (below 10
−2
s
−1
) or high (above 10
2
s
−1
) strain rate regime.
However, a significant strain rate effect on true failure strain was observed when the strain rate fell into the intermediate
strain-rate regime between 10
−2
and 10
2
s
−1
.
Fig. 1.2 Tensile stress-strain
curves at various strain rates
1 Mechanical Characterization of 304L-VAR Stainless Steel in Tension with a Full Coverage from Low, Intermediate…
MTS tests and short specimens (Fig. 1.1b) were used for Drop-Hopkinson bar tests in this study. The fast MTS was used to
cover the lower portion of the intermediate strain rate regime and the higher portion was covered with a Drop-Hopkinson bar.
A Phantom camera system was synchronized with the fast MTS for in situ specimen deformation measurement over the gage
section. A dynamic load washer was used to measure the force during the fast MTS tests. The procedure of the DropHopkinson bar tests was presented in [5]. A high-speed laser extensometer was employed to accurately track the in situ
motion of the incident and transmission bar ends independently with a split beam of a line laser into two separate high-speed
photodetectors [6]. It is noted that the specimen deformation over the gage section was corrected from the high-speed laser
extensometer measurement [7].
High-strain-rate tensile tests were conducted with a Kolsky tension bar. The stress history of the sample is therefore
obtained using the transmitted strain signal [8]. The same high-speed laser extensometer and posttest correction method were
applied to calculate specimen strain over the gage section.
Following the procedure presented previously, the 304L- VAR stainless steel was characterized in tension at various
strain rates ranging from 0.0001 to ~2580 s
−1
with full coverage in the intermediate strain rate regime. At each condition, 3–5 tests were repeated, and the mean curves were calculated and are shown in Fig. 1.2. As shown in Fig. 1.2, the
304L- VAR stainless steel clearly possessed a typical elastic- hardening tensile response, until the onset of necking, with
significant strain-rate effect. At certain engineering strains, the flow stresses increased with increasing strain rates, as
shown in Fig. 1.3.
Since the specimen failed within a highly localized region, it is erroneous to use the engineering measurement over the
entire gage section to calculate the failure strain. In this study, the minimum neck diameter was measured for all posttest
tensile specimens to calculate true failure strains [9]. Figure 1.4 shows the strain rate effect on true failure strain. The true
failure strain decreased with increasing strain rate, although the data was scattered. The true failure strains were around 210%
at low strain rates but dropped to around 110% at high strain rates on the order of 10
3
s
−1
. The true failure strains were not
observed to be significantly dependent on strain rate within the low (below 10
−2
s
−1
) or high (above 10
2
s
−1
) strain rate regime.
However, a significant strain rate effect on true failure strain was observed when the strain rate fell into the intermediate
strain-rate regime between 10
−2
and 10
2
s
−1
.
Fig. 1.2 Tensile stress-strain
curves at various strain rates
1 Mechanical Characterization of 304L-VAR Stainless Steel in Tension with a Full Coverage from Low, Intermediate…