

426
8 Morphogenesis
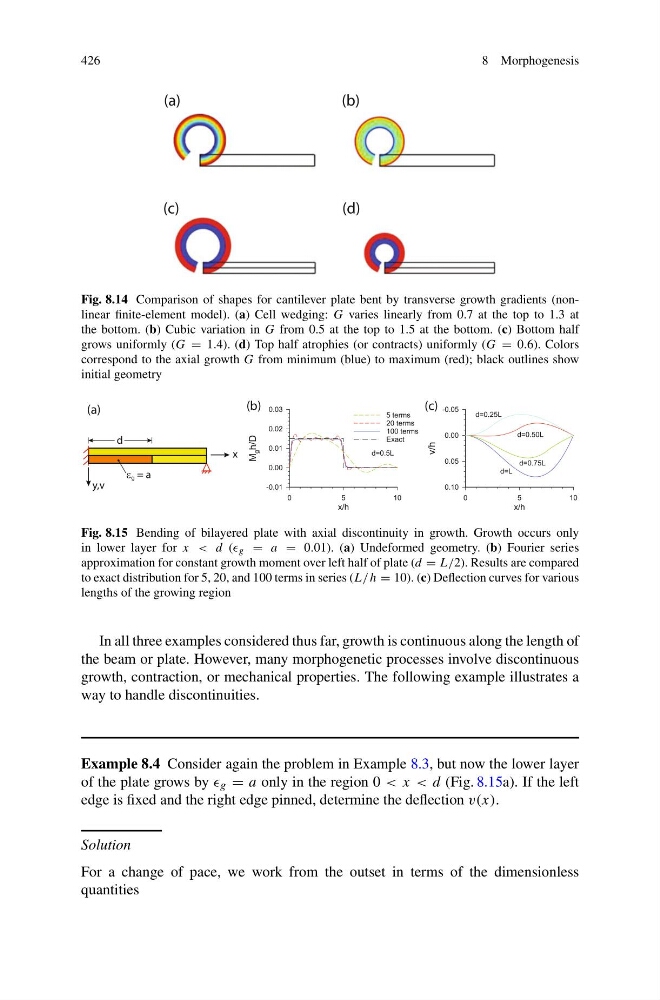
Fig. 8.14 Comparison of shapes for cantilever plate bent by transverse growth gradients (nonlinear finite-element model). (a) Cell wedging: G varies linearly from 0.7 at the top to 1.3 at
the bottom. (b) Cubic variation in G from 0.5 at the top to 1.5 at the bottom. (c) Bottom half
grows uniformly (G = 1.4). (d) Top half atrophies (or contracts) uniformly (G = 0.6). Colors
correspond to the axial growth G from minimum (blue) to maximum (red); black outlines show
initial geometry
(a)
)
c
(
)
b
(
ε g = a
x
d
y,v
Fig. 8.15 Bending of bilayered plate with axial discontinuity in growth. Growth occurs only
in lower layer for x < d ( g = a = 0.01). (a) Undeformed geometry. (b) Fourier series
approximation for constant growth moment over left half of plate (d = L/2). Results are compared
to exact distribution for 5, 20, and 100 terms in series (L/ h = 10). (c) Deflection curves for various
lengths of the growing region
In all three examples considered thus far, growth is continuous along the length of
the beam or plate. However, many morphogenetic processes involve discontinuous
growth, contraction, or mechanical properties. The following example illustrates a
way to handle discontinuities.
Example 8.4 Consider again the problem in Example 8.3, but now the lower layer
of the plate grows by g = a only in the region 0 < x < d (Fig. 8.15a). If the left
edge is fixed and the right edge pinned, determine the deflection v(x).
Solution
For a change of pace, we work from the outset in terms of the dimensionless
quantities
8 Morphogenesis
Fig. 8.14 Comparison of shapes for cantilever plate bent by transverse growth gradients (nonlinear finite-element model). (a) Cell wedging: G varies linearly from 0.7 at the top to 1.3 at
the bottom. (b) Cubic variation in G from 0.5 at the top to 1.5 at the bottom. (c) Bottom half
grows uniformly (G = 1.4). (d) Top half atrophies (or contracts) uniformly (G = 0.6). Colors
correspond to the axial growth G from minimum (blue) to maximum (red); black outlines show
initial geometry
(a)
)
c
(
)
b
(
ε g = a
x
d
y,v
Fig. 8.15 Bending of bilayered plate with axial discontinuity in growth. Growth occurs only
in lower layer for x < d ( g = a = 0.01). (a) Undeformed geometry. (b) Fourier series
approximation for constant growth moment over left half of plate (d = L/2). Results are compared
to exact distribution for 5, 20, and 100 terms in series (L/ h = 10). (c) Deflection curves for various
lengths of the growing region
In all three examples considered thus far, growth is continuous along the length of
the beam or plate. However, many morphogenetic processes involve discontinuous
growth, contraction, or mechanical properties. The following example illustrates a
way to handle discontinuities.
Example 8.4 Consider again the problem in Example 8.3, but now the lower layer
of the plate grows by g = a only in the region 0 < x < d (Fig. 8.15a). If the left
edge is fixed and the right edge pinned, determine the deflection v(x).
Solution
For a change of pace, we work from the outset in terms of the dimensionless
quantities