

contents of the lithium–montmorillonite (Li–MMT) clay. The absence of the Na
peak in EDS spectra evidences the de-intercalation of Na and the intercalation of the
Li–ion. XRD analysis suggested the decrease of the interlayer spacing from 32.43 to
25.66 Å with increase of the clay content from 10 to 25 wt.% and evidences difficult
for polymer intercalation in the clay gallery. Further, for 20 wt.% of nanoclay
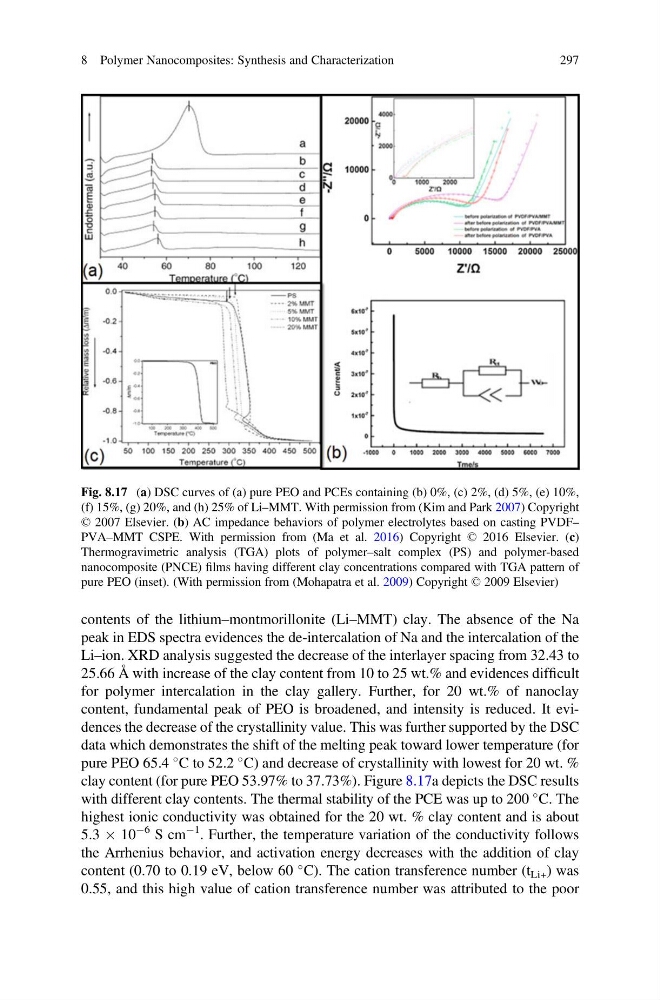
content, fundamental peak of PEO is broadened, and intensity is reduced. It evidences the decrease of the crystallinity value. This was further supported by the DSC
data which demonstrates the shift of the melting peak toward lower temperature (for
pure PEO 65.4
C to 52.2
C) and decrease of crystallinity with lowest for 20 wt. %
clay content (for pure PEO 53.97% to 37.73%). Figure 8.17a depicts the DSC results
with different clay contents. The thermal stability of the PCE was up to 200
C. The
highest ionic conductivity was obtained for the 20 wt. % clay content and is about
5.3 Â 10
À6 S cm
À1 . Further, the temperature variation of the conductivity follows
the Arrhenius behavior, and activation energy decreases with the addition of clay
content (0.70 to 0.19 eV, below 60
C). The cation transference number (t Li+ ) was
0.55, and this high value of cation transference number was attributed to the poor
Fig. 8.17 (a) DSC curves of (a) pure PEO and PCEs containing (b) 0%, (c) 2%, (d) 5%, (e) 10%,
(f) 15%, (g) 20%, and (h) 25% of Li–MMT. With permission from (Kim and Park 2007) Copyright
© 2007 Elsevier. (b) AC impedance behaviors of polymer electrolytes based on casting PVDF–
PVA–MMT CSPE. With permission from (Ma et al. 2016) Copyright © 2016 Elsevier. (c)
Thermogravimetric analysis (TGA) plots of polymer–salt complex (PS) and polymer-based
nanocomposite (PNCE) films having different clay concentrations compared with TGA pattern of
pure PEO (inset). (With permission from (Mohapatra et al. 2009) Copyright © 2009 Elsevier)
8 Polymer Nanocomposites: Synthesis and Characterization
297
peak in EDS spectra evidences the de-intercalation of Na and the intercalation of the
Li–ion. XRD analysis suggested the decrease of the interlayer spacing from 32.43 to
25.66 Å with increase of the clay content from 10 to 25 wt.% and evidences difficult
for polymer intercalation in the clay gallery. Further, for 20 wt.% of nanoclay
content, fundamental peak of PEO is broadened, and intensity is reduced. It evidences the decrease of the crystallinity value. This was further supported by the DSC
data which demonstrates the shift of the melting peak toward lower temperature (for
pure PEO 65.4
C to 52.2
C) and decrease of crystallinity with lowest for 20 wt. %
clay content (for pure PEO 53.97% to 37.73%). Figure 8.17a depicts the DSC results
with different clay contents. The thermal stability of the PCE was up to 200
C. The
highest ionic conductivity was obtained for the 20 wt. % clay content and is about
5.3 Â 10
À6 S cm
À1 . Further, the temperature variation of the conductivity follows
the Arrhenius behavior, and activation energy decreases with the addition of clay
content (0.70 to 0.19 eV, below 60
C). The cation transference number (t Li+ ) was
0.55, and this high value of cation transference number was attributed to the poor
Fig. 8.17 (a) DSC curves of (a) pure PEO and PCEs containing (b) 0%, (c) 2%, (d) 5%, (e) 10%,
(f) 15%, (g) 20%, and (h) 25% of Li–MMT. With permission from (Kim and Park 2007) Copyright
© 2007 Elsevier. (b) AC impedance behaviors of polymer electrolytes based on casting PVDF–
PVA–MMT CSPE. With permission from (Ma et al. 2016) Copyright © 2016 Elsevier. (c)
Thermogravimetric analysis (TGA) plots of polymer–salt complex (PS) and polymer-based
nanocomposite (PNCE) films having different clay concentrations compared with TGA pattern of
pure PEO (inset). (With permission from (Mohapatra et al. 2009) Copyright © 2009 Elsevier)
8 Polymer Nanocomposites: Synthesis and Characterization
297