

stress as promoting shearing. Where this stress is
perpendicular to the fault, the cause of shearing is
a puzzle that remains to be resolved.
6.3.1 Anderson’s standard state and
variations of stress with depth
For the coordinate system shown in Fig. 6.28, and
the stress components and body force component
illustrated there, the state of stress envisioned by
Anderson is defined as follows:
(6.100)
Here �g* is the weight per unit volume of rock.
Positive z is upward from the surface, so the
normal stress components are negative (compressive) below the surface, and they increase in magnitude linearly with depth for a constant unit
weight.
Values for the unit weight of rock vary from
about 2.0 � 10
4 to 3.5 � 10
4 N m
�3 with a pure
quartzite having a unit weight of 2.65 � 10
4 N m
�3
(Daly et al., 1966). Summarizing many individual
measurements of the vertical stress component,
� zz , a value of 0.0265 MPa m
�1 is reported for data
from around the world at depths ranging from
100 to 3000 m (McGarr and Gay, 1978), a value of
0.0285 MPa m
�1 over the depth range from 0 to
2300 m is reported for the Canadian Shield
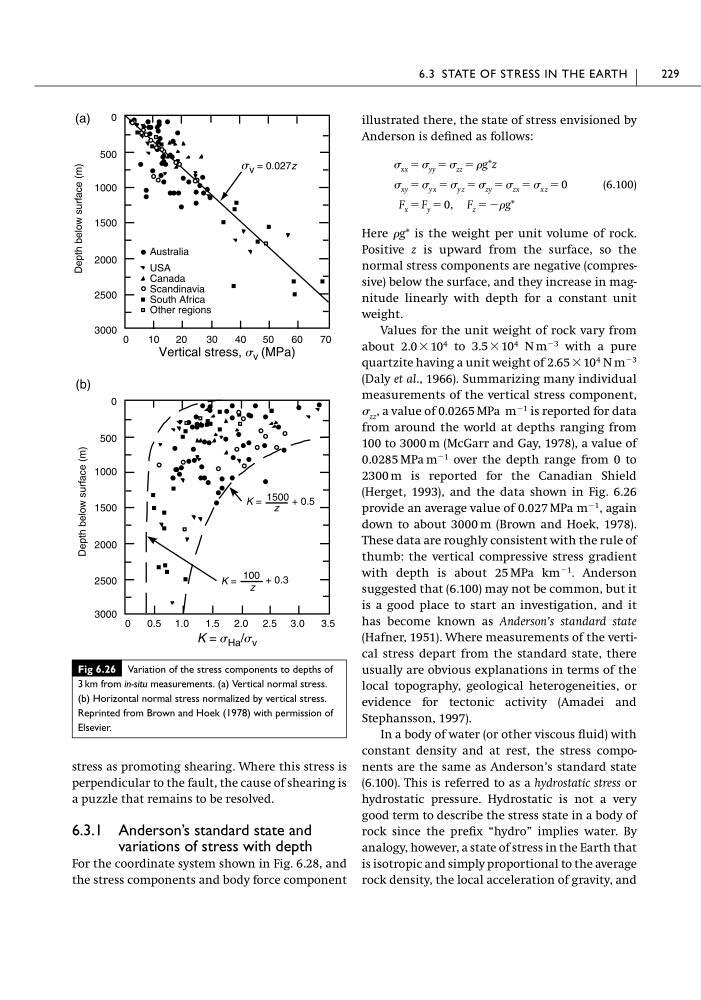
(Herget, 1993), and the data shown in Fig. 6.26
provide an average value of 0.027 MPa m
�1 , again
down to about 3000 m (Brown and Hoek, 1978).
These data are roughly consistent with the rule of
thumb: the vertical compressive stress gradient
with depth is about 25 MPa km
�1 . Anderson
suggested that (6.100) may not be common, but it
is a good place to start an investigation, and it
has become known as Anderson’s standard state
(Hafner, 1951). Where measurements of the vertical stress depart from the standard state, there
usually are obvious explanations in terms of the
local topography, geological heterogeneities, or
evidence for tectonic activity (Amadei and
Stephansson, 1997).
In a body of water (or other viscous fluid) with
constant density and at rest, the stress components are the same as Anderson’s standard state
(6.100). This is referred to as a hydrostatic stress or
hydrostatic pressure. Hydrostatic is not a very
good term to describe the stress state in a body of
rock since the prefix “hydro” implies water. By
analogy, however, a state of stress in the Earth that
is isotropic and simply proportional to the average
rock density, the local acceleration of gravity, and
F x � F y � 0, F z � ��g*
� xy � � y x � � y z � � zy � � zx � � x z � 0
� xx � � yy � � zz � �g*z
6.3 STATE OF STRESS IN THE EARTH
229
Fig 6.26 Variation of the stress components to depths of
3 km from in-situ measurements. (a) Vertical normal stress.
(b) Horizontal normal stress normalized by vertical stress.
Reprinted from Brown and Hoek (1978) with permission of
Elsevier.
Australia
USA
Canada
Scandinavia
South Africa
Other regions
0
500
1000
1500
2000
2500
3000 0
10
20
40
50
60
70
30
Depth below surface (m)
0
500
1000
1500
2000
2500
3000
Depth below surface (m)
K = 1500
z
+ 0.5
K =
100
z
+ 0.3
0
0.5 1.0
1.5 2.0 2.5 3.0
3.5
(a)
(b)
s v = 0.027z
Vertical stress, s v (MPa)
K = s Ha /s v
perpendicular to the fault, the cause of shearing is
a puzzle that remains to be resolved.
6.3.1 Anderson’s standard state and
variations of stress with depth
For the coordinate system shown in Fig. 6.28, and
the stress components and body force component
illustrated there, the state of stress envisioned by
Anderson is defined as follows:
(6.100)
Here �g* is the weight per unit volume of rock.
Positive z is upward from the surface, so the
normal stress components are negative (compressive) below the surface, and they increase in magnitude linearly with depth for a constant unit
weight.
Values for the unit weight of rock vary from
about 2.0 � 10
4 to 3.5 � 10
4 N m
�3 with a pure
quartzite having a unit weight of 2.65 � 10
4 N m
�3
(Daly et al., 1966). Summarizing many individual
measurements of the vertical stress component,
� zz , a value of 0.0265 MPa m
�1 is reported for data
from around the world at depths ranging from
100 to 3000 m (McGarr and Gay, 1978), a value of
0.0285 MPa m
�1 over the depth range from 0 to
2300 m is reported for the Canadian Shield
(Herget, 1993), and the data shown in Fig. 6.26
provide an average value of 0.027 MPa m
�1 , again
down to about 3000 m (Brown and Hoek, 1978).
These data are roughly consistent with the rule of
thumb: the vertical compressive stress gradient
with depth is about 25 MPa km
�1 . Anderson
suggested that (6.100) may not be common, but it
is a good place to start an investigation, and it
has become known as Anderson’s standard state
(Hafner, 1951). Where measurements of the vertical stress depart from the standard state, there
usually are obvious explanations in terms of the
local topography, geological heterogeneities, or
evidence for tectonic activity (Amadei and
Stephansson, 1997).
In a body of water (or other viscous fluid) with
constant density and at rest, the stress components are the same as Anderson’s standard state
(6.100). This is referred to as a hydrostatic stress or
hydrostatic pressure. Hydrostatic is not a very
good term to describe the stress state in a body of
rock since the prefix “hydro” implies water. By
analogy, however, a state of stress in the Earth that
is isotropic and simply proportional to the average
rock density, the local acceleration of gravity, and
F x � F y � 0, F z � ��g*
� xy � � y x � � y z � � zy � � zx � � x z � 0
� xx � � yy � � zz � �g*z
6.3 STATE OF STRESS IN THE EARTH
229
Fig 6.26 Variation of the stress components to depths of
3 km from in-situ measurements. (a) Vertical normal stress.
(b) Horizontal normal stress normalized by vertical stress.
Reprinted from Brown and Hoek (1978) with permission of
Elsevier.
Australia
USA
Canada
Scandinavia
South Africa
Other regions
0
500
1000
1500
2000
2500
3000 0
10
20
40
50
60
70
30
Depth below surface (m)
0
500
1000
1500
2000
2500
3000
Depth below surface (m)
K = 1500
z
+ 0.5
K =
100
z
+ 0.3
0
0.5 1.0
1.5 2.0 2.5 3.0
3.5
(a)
(b)
s v = 0.027z
Vertical stress, s v (MPa)
K = s Ha /s v