

155
decades before most people even begin to think about how well they are placed to
manage financially in later life’ (McGrath 2015, p. 5). This means that many elderly
women in Australia are reliant on the age pension, which has been deemed inadequate and insufficient (Pattern 2016; Society et al. 2016). In a report into the adequacy of the age pension, one retiree highlighted that ‘after paying major bills, we
have $180 a fortnight to live on’ (Society et al. 2016, p. 34). A similar report by the
Association of Superannuation Funds of Australia found that to maintain a modest
style of living in retirement, a single person household requires $524.30 per week
(Australia 2018). However, this estimate figure excludes rent or mortgage payments
and thus assumes that retirees own their principle place of residence outright.
Moreover, this ‘modest’ estimate is 13% more than the current age pension which
is approximately $458.15 per week (Services 2019a). It is evident that relying solely
on the age pension in retirement places elderly retirees in a precarious financial situation. Consequently, the focus of this chapter lies in understanding the contributing
factors behind the financial disparity in retirement between genders; critically, this
chapter will pay particular attention to how sub-goals of sustainable development
(SDG) 10 can facilitate a narrowing in the gender gap in super balances between
men and women.
The structural biases innate within the foundations of Australia’s superannuation
system impede upon the achievement of SDG 10 – the reduction of inequality.
Crucially, a key sub-goal of SDG 10 is to eliminate discriminatory policies in favour
of programmes which enable social protection and thus the achievement of equality.
Sub-targets 10.3 and 10.4 demand equal opportunity via the abolition of discriminatory laws, policies, and practices; moreover, sub-target 10.2 advocates for the
promotion of empowerment and the economic inclusion of all, irrespective of age,
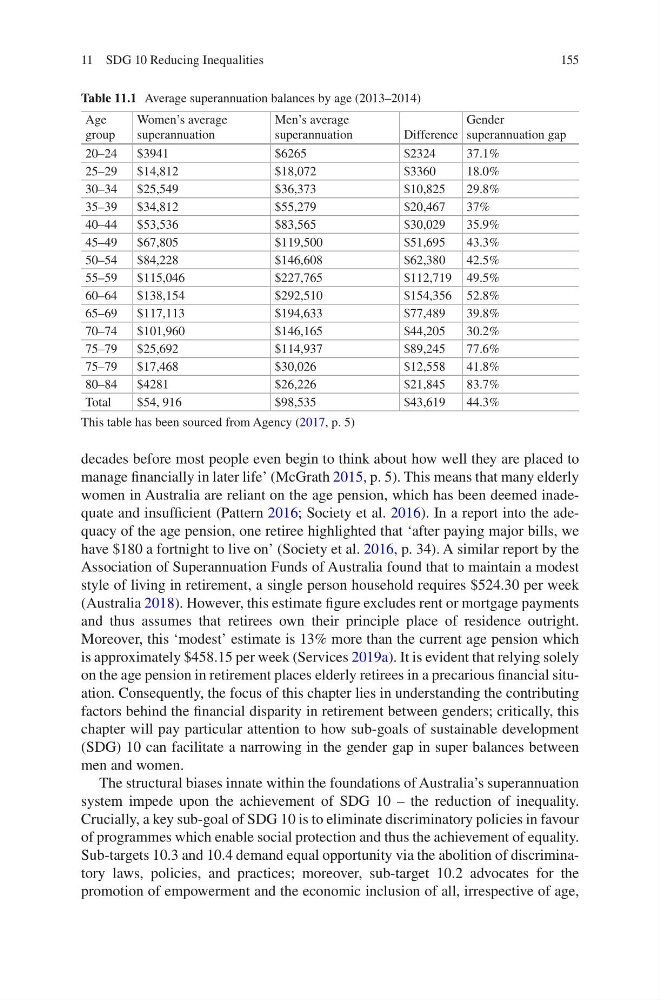
Table 11.1 Average superannuation balances by age (2013–2014)
Age
group
Women’s average
superannuation
Men’s average
superannuation
Difference
Gender
superannuation gap
20–24
$3941
$6265
$2324
37.1%
25–29
$14,812
$18,072
$3360
18.0%
30–34
$25,549
$36,373
$10,825
29.8%
35–39
$34,812
$55,279
$20,467
37%
40–44
$53,536
$83,565
$30,029
35.9%
45–49
$67,805
$119,500
$51,695
43.3%
50–54
$84,228
$146,608
$62,380
42.5%
55–59
$115,046
$227,765
$112,719 49.5%
60–64
$138,154
$292,510
$154,356 52.8%
65–69
$117,113
$194,633
$77,489
39.8%
70–74
$101,960
$146,165
$44,205
30.2%
75–79
$25,692
$114,937
$89,245
77.6%
75–79
$17,468
$30,026
$12,558
41.8%
80–84
$4281
$26,226
$21,845
83.7%
Total
$54, 916
$98,535
$43,619
44.3%
This table has been sourced from Agency (2017, p. 5)
11 SDG 10 Reducing Inequalities
decades before most people even begin to think about how well they are placed to
manage financially in later life’ (McGrath 2015, p. 5). This means that many elderly
women in Australia are reliant on the age pension, which has been deemed inadequate and insufficient (Pattern 2016; Society et al. 2016). In a report into the adequacy of the age pension, one retiree highlighted that ‘after paying major bills, we
have $180 a fortnight to live on’ (Society et al. 2016, p. 34). A similar report by the
Association of Superannuation Funds of Australia found that to maintain a modest
style of living in retirement, a single person household requires $524.30 per week
(Australia 2018). However, this estimate figure excludes rent or mortgage payments
and thus assumes that retirees own their principle place of residence outright.
Moreover, this ‘modest’ estimate is 13% more than the current age pension which
is approximately $458.15 per week (Services 2019a). It is evident that relying solely
on the age pension in retirement places elderly retirees in a precarious financial situation. Consequently, the focus of this chapter lies in understanding the contributing
factors behind the financial disparity in retirement between genders; critically, this
chapter will pay particular attention to how sub-goals of sustainable development
(SDG) 10 can facilitate a narrowing in the gender gap in super balances between
men and women.
The structural biases innate within the foundations of Australia’s superannuation
system impede upon the achievement of SDG 10 – the reduction of inequality.
Crucially, a key sub-goal of SDG 10 is to eliminate discriminatory policies in favour
of programmes which enable social protection and thus the achievement of equality.
Sub-targets 10.3 and 10.4 demand equal opportunity via the abolition of discriminatory laws, policies, and practices; moreover, sub-target 10.2 advocates for the
promotion of empowerment and the economic inclusion of all, irrespective of age,
Table 11.1 Average superannuation balances by age (2013–2014)
Age
group
Women’s average
superannuation
Men’s average
superannuation
Difference
Gender
superannuation gap
20–24
$3941
$6265
$2324
37.1%
25–29
$14,812
$18,072
$3360
18.0%
30–34
$25,549
$36,373
$10,825
29.8%
35–39
$34,812
$55,279
$20,467
37%
40–44
$53,536
$83,565
$30,029
35.9%
45–49
$67,805
$119,500
$51,695
43.3%
50–54
$84,228
$146,608
$62,380
42.5%
55–59
$115,046
$227,765
$112,719 49.5%
60–64
$138,154
$292,510
$154,356 52.8%
65–69
$117,113
$194,633
$77,489
39.8%
70–74
$101,960
$146,165
$44,205
30.2%
75–79
$25,692
$114,937
$89,245
77.6%
75–79
$17,468
$30,026
$12,558
41.8%
80–84
$4281
$26,226
$21,845
83.7%
Total
$54, 916
$98,535
$43,619
44.3%
This table has been sourced from Agency (2017, p. 5)
11 SDG 10 Reducing Inequalities