

15 Drought and Insolvency: Case Study of the Producer-Buyer …
505
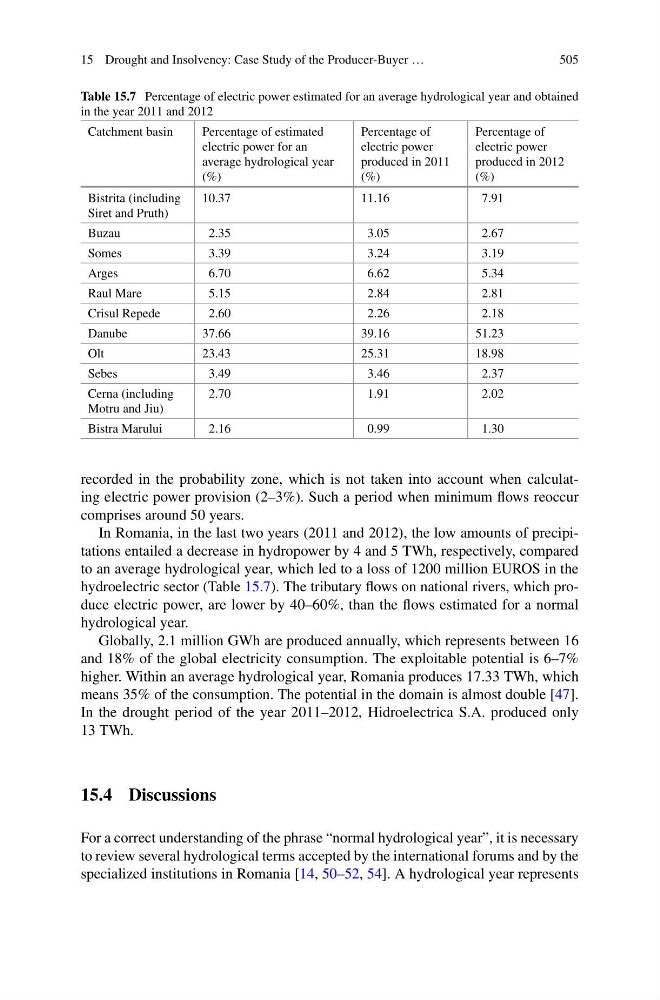
Table 15.7 Percentage of electric power estimated for an average hydrological year and obtained
in the year 2011 and 2012
Catchment basin
Percentage of estimated
electric power for an
average hydrological year
(%)
Percentage of
electric power
produced in 2011
(%)
Percentage of
electric power
produced in 2012
(%)
Bistrita (including
Siret and Pruth)
10.37
11.16
7.91
Buzau
2.35
3.05
2.67
Somes
3.39
3.24
3.19
Arges
6.70
6.62
5.34
Raul Mare
5.15
2.84
2.81
Crisul Repede
2.60
2.26
2.18
Danube
37.66
39.16
51.23
Olt
23.43
25.31
18.98
Sebes
3.49
3.46
2.37
Cerna (including
Motru and Jiu)
2.70
1.91
2.02
Bistra Marului
2.16
0.99
1.30
recorded in the probability zone, which is not taken into account when calculating electric power provision (2–3%). Such a period when minimum flows reoccur
comprises around 50 years.
In Romania, in the last two years (2011 and 2012), the low amounts of precipitations entailed a decrease in hydropower by 4 and 5 TWh, respectively, compared
to an average hydrological year, which led to a loss of 1200 million EUROS in the
hydroelectric sector (Table 15.7). The tributary flows on national rivers, which produce electric power, are lower by 40–60%, than the flows estimated for a normal
hydrological year.
Globally, 2.1 million GWh are produced annually, which represents between 16
and 18% of the global electricity consumption. The exploitable potential is 6–7%
higher. Within an average hydrological year, Romania produces 17.33 TWh, which
means 35% of the consumption. The potential in the domain is almost double [47].
In the drought period of the year 2011–2012, Hidroelectrica S.A. produced only
13 TWh.
15.4 Discussions
For a correct understanding of the phrase “normal hydrological year”, it is necessary
to review several hydrological terms accepted by the international forums and by the
specialized institutions in Romania [14, 50–52, 54]. A hydrological year represents
505
Table 15.7 Percentage of electric power estimated for an average hydrological year and obtained
in the year 2011 and 2012
Catchment basin
Percentage of estimated
electric power for an
average hydrological year
(%)
Percentage of
electric power
produced in 2011
(%)
Percentage of
electric power
produced in 2012
(%)
Bistrita (including
Siret and Pruth)
10.37
11.16
7.91
Buzau
2.35
3.05
2.67
Somes
3.39
3.24
3.19
Arges
6.70
6.62
5.34
Raul Mare
5.15
2.84
2.81
Crisul Repede
2.60
2.26
2.18
Danube
37.66
39.16
51.23
Olt
23.43
25.31
18.98
Sebes
3.49
3.46
2.37
Cerna (including
Motru and Jiu)
2.70
1.91
2.02
Bistra Marului
2.16
0.99
1.30
recorded in the probability zone, which is not taken into account when calculating electric power provision (2–3%). Such a period when minimum flows reoccur
comprises around 50 years.
In Romania, in the last two years (2011 and 2012), the low amounts of precipitations entailed a decrease in hydropower by 4 and 5 TWh, respectively, compared
to an average hydrological year, which led to a loss of 1200 million EUROS in the
hydroelectric sector (Table 15.7). The tributary flows on national rivers, which produce electric power, are lower by 40–60%, than the flows estimated for a normal
hydrological year.
Globally, 2.1 million GWh are produced annually, which represents between 16
and 18% of the global electricity consumption. The exploitable potential is 6–7%
higher. Within an average hydrological year, Romania produces 17.33 TWh, which
means 35% of the consumption. The potential in the domain is almost double [47].
In the drought period of the year 2011–2012, Hidroelectrica S.A. produced only
13 TWh.
15.4 Discussions
For a correct understanding of the phrase “normal hydrological year”, it is necessary
to review several hydrological terms accepted by the international forums and by the
specialized institutions in Romania [14, 50–52, 54]. A hydrological year represents