

478
A.-E. Briciu et al.
equivalent air temperatures occur 1 h earlier (mean temperature: 6.03 °C). Water level
(mean: 0.517 psi), atmospheric pressure (mean: 14.161 psi), air relative humidity
(mean: 89.51%) and water electrical conductivity (mean: 588 µS/cm) have the same
behavior previously observed in sites 1 and 2. However, beyond the common behavior
shown by the electrical conductivity diurnal profile, Briciu et al. [8] revealed that, on
some short intervals of consecutive days, significant semidiurnal oscillations could
be found, with a period equal to those of the atmospheric tides. This phenomenon is
explained as being caused by the thermal karst waters that Cib River collects inside
Cib Gorge.
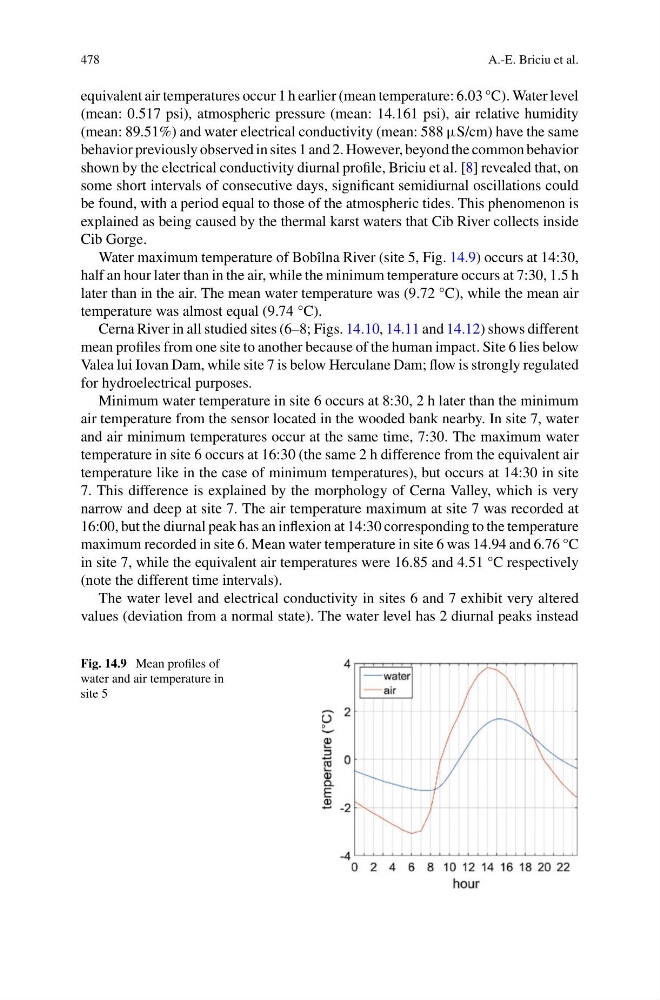
Water maximum temperature of Bobîlna River (site 5, Fig. 14.9) occurs at 14:30,
half an hour later than in the air, while the minimum temperature occurs at 7:30, 1.5 h
later than in the air. The mean water temperature was (9.72 °C), while the mean air
temperature was almost equal (9.74 °C).
Cerna River in all studied sites (6–8; Figs. 14.10, 14.11 and 14.12) shows different
mean profiles from one site to another because of the human impact. Site 6 lies below
Valea lui Iovan Dam, while site 7 is below Herculane Dam; flow is strongly regulated
for hydroelectrical purposes.
Minimum water temperature in site 6 occurs at 8:30, 2 h later than the minimum
air temperature from the sensor located in the wooded bank nearby. In site 7, water
and air minimum temperatures occur at the same time, 7:30. The maximum water
temperature in site 6 occurs at 16:30 (the same 2 h difference from the equivalent air
temperature like in the case of minimum temperatures), but occurs at 14:30 in site
7. This difference is explained by the morphology of Cerna Valley, which is very
narrow and deep at site 7. The air temperature maximum at site 7 was recorded at
16:00, but the diurnal peak has an inflexion at 14:30 corresponding to the temperature
maximum recorded in site 6. Mean water temperature in site 6 was 14.94 and 6.76 °C
in site 7, while the equivalent air temperatures were 16.85 and 4.51 °C respectively
(note the different time intervals).
The water level and electrical conductivity in sites 6 and 7 exhibit very altered
values (deviation from a normal state). The water level has 2 diurnal peaks instead
Fig. 14.9 Mean profiles of
water and air temperature in
site 5
A.-E. Briciu et al.
equivalent air temperatures occur 1 h earlier (mean temperature: 6.03 °C). Water level
(mean: 0.517 psi), atmospheric pressure (mean: 14.161 psi), air relative humidity
(mean: 89.51%) and water electrical conductivity (mean: 588 µS/cm) have the same
behavior previously observed in sites 1 and 2. However, beyond the common behavior
shown by the electrical conductivity diurnal profile, Briciu et al. [8] revealed that, on
some short intervals of consecutive days, significant semidiurnal oscillations could
be found, with a period equal to those of the atmospheric tides. This phenomenon is
explained as being caused by the thermal karst waters that Cib River collects inside
Cib Gorge.
Water maximum temperature of Bobîlna River (site 5, Fig. 14.9) occurs at 14:30,
half an hour later than in the air, while the minimum temperature occurs at 7:30, 1.5 h
later than in the air. The mean water temperature was (9.72 °C), while the mean air
temperature was almost equal (9.74 °C).
Cerna River in all studied sites (6–8; Figs. 14.10, 14.11 and 14.12) shows different
mean profiles from one site to another because of the human impact. Site 6 lies below
Valea lui Iovan Dam, while site 7 is below Herculane Dam; flow is strongly regulated
for hydroelectrical purposes.
Minimum water temperature in site 6 occurs at 8:30, 2 h later than the minimum
air temperature from the sensor located in the wooded bank nearby. In site 7, water
and air minimum temperatures occur at the same time, 7:30. The maximum water
temperature in site 6 occurs at 16:30 (the same 2 h difference from the equivalent air
temperature like in the case of minimum temperatures), but occurs at 14:30 in site
7. This difference is explained by the morphology of Cerna Valley, which is very
narrow and deep at site 7. The air temperature maximum at site 7 was recorded at
16:00, but the diurnal peak has an inflexion at 14:30 corresponding to the temperature
maximum recorded in site 6. Mean water temperature in site 6 was 14.94 and 6.76 °C
in site 7, while the equivalent air temperatures were 16.85 and 4.51 °C respectively
(note the different time intervals).
The water level and electrical conductivity in sites 6 and 7 exhibit very altered
values (deviation from a normal state). The water level has 2 diurnal peaks instead
Fig. 14.9 Mean profiles of
water and air temperature in
site 5