

338
L. Zaharia et al.
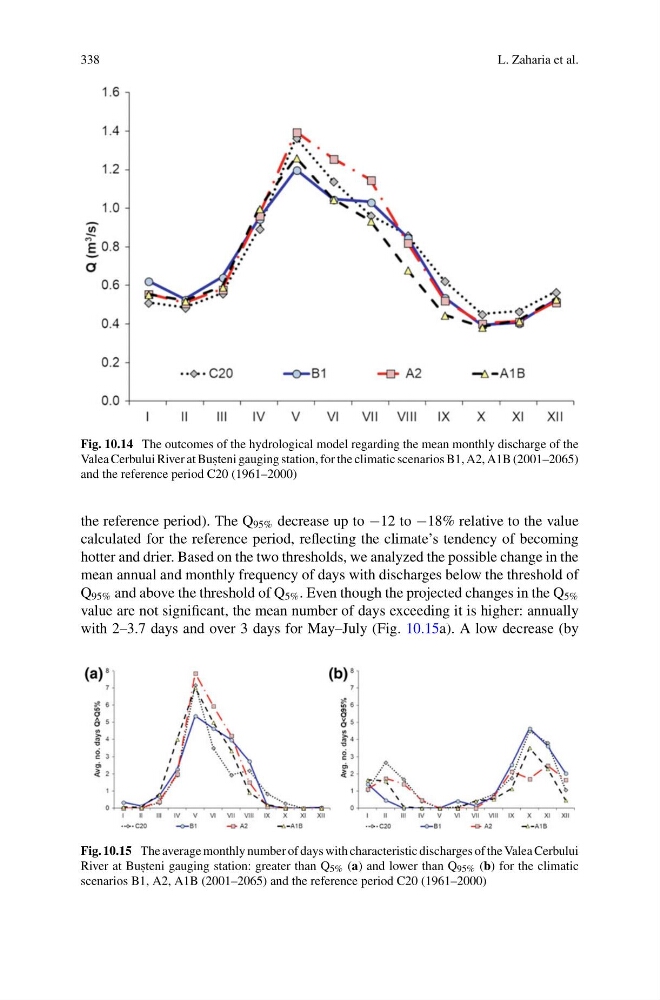
Fig. 10.14 The outcomes of the hydrological model regarding the mean monthly discharge of the
Valea Cerbului River at Bus , teni gauging station, for the climatic scenarios B1, A2, A1B (2001–2065)
and the reference period C20 (1961–2000)
the reference period). The Q 95% decrease up to −12 to −18% relative to the value
calculated for the reference period, reflecting the climate’s tendency of becoming
hotter and drier. Based on the two thresholds, we analyzed the possible change in the
mean annual and monthly frequency of days with discharges below the threshold of
Q 95% and above the threshold of Q 5% . Even though the projected changes in the Q 5%
value are not significant, the mean number of days exceeding it is higher: annually
with 2–3.7 days and over 3 days for May–July (Fig. 10.15a). A low decrease (by
Fig. 10.15 The average monthly number of days with characteristic discharges of the Valea Cerbului
River at Bus , teni gauging station: greater than Q 5% (a) and lower than Q 95% (b) for the climatic
scenarios B1, A2, A1B (2001–2065) and the reference period C20 (1961–2000)
L. Zaharia et al.
Fig. 10.14 The outcomes of the hydrological model regarding the mean monthly discharge of the
Valea Cerbului River at Bus , teni gauging station, for the climatic scenarios B1, A2, A1B (2001–2065)
and the reference period C20 (1961–2000)
the reference period). The Q 95% decrease up to −12 to −18% relative to the value
calculated for the reference period, reflecting the climate’s tendency of becoming
hotter and drier. Based on the two thresholds, we analyzed the possible change in the
mean annual and monthly frequency of days with discharges below the threshold of
Q 95% and above the threshold of Q 5% . Even though the projected changes in the Q 5%
value are not significant, the mean number of days exceeding it is higher: annually
with 2–3.7 days and over 3 days for May–July (Fig. 10.15a). A low decrease (by
Fig. 10.15 The average monthly number of days with characteristic discharges of the Valea Cerbului
River at Bus , teni gauging station: greater than Q 5% (a) and lower than Q 95% (b) for the climatic
scenarios B1, A2, A1B (2001–2065) and the reference period C20 (1961–2000)