

10 Hydrological Impacts of Climate Changes in Romania
335
last two decades is increasing and consistent with their magnitude, namely with the
trends identified for the mean and maximum discharges (Fig. 10.11b).
10.5.2.2 Changes in the Magnitude and Frequency of Low Flows
At interannual level, the magnitude of low annual flows (based on mean daily discharges) is decreasing during the analyzed period (1961–2012). Thus, the data show
a positive trend of the annual minimum discharges with a significance level α of 0.05.
The low monthly flows have, in general, the same positive trend, statistically significant for January to March and December (for α = 0.05 to α = 0.01). The exception
is given by the low flows in April to July, for which a negative trend was identified (statistically non-significant). Seasonally, the minimum discharges have upward
trends in spring (for α = 0.1), winter (for α = 0.01 in) and autumn (statistically nonsignificant), and a downward trend in summer (statistically non-significant). The
trend identified in the low flows, correlated with the seasonal frequency of floods
lead to the conclusion that for the analyzed period, the hydrological regime tends to
become more extreme in the summer for both low and high flows and attenuated in
the winter.
The frequency and the duration of low flows were determined by considering as
a threshold the discharge (Q) with 95% exceedance probability (the 5th percentile),
based on recorded mean daily discharges during 1961–2012 (Q 95% = 0.092 m
3 /s).
We considered as low flow period any period of at least 10 consecutive days with
discharges below this value. This method helps to identify the driest years for the
study area, regarding hydrological drought duration.
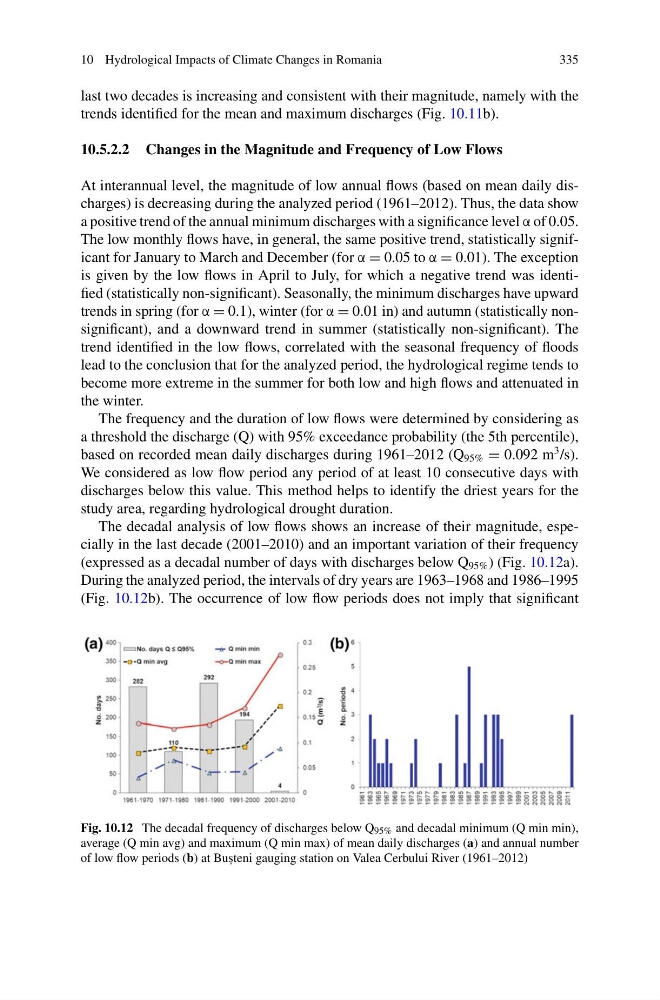
The decadal analysis of low flows shows an increase of their magnitude, especially in the last decade (2001–2010) and an important variation of their frequency
(expressed as a decadal number of days with discharges below Q 95% ) (Fig. 10.12a).
During the analyzed period, the intervals of dry years are 1963–1968 and 1986–1995
(Fig. 10.12b). The occurrence of low flow periods does not imply that significant
Fig. 10.12 The decadal frequency of discharges below Q 95% and decadal minimum (Q min min),
average (Q min avg) and maximum (Q min max) of mean daily discharges (a) and annual number
of low flow periods (b) at Bus , teni gauging station on Valea Cerbului River (1961–2012)
335
last two decades is increasing and consistent with their magnitude, namely with the
trends identified for the mean and maximum discharges (Fig. 10.11b).
10.5.2.2 Changes in the Magnitude and Frequency of Low Flows
At interannual level, the magnitude of low annual flows (based on mean daily discharges) is decreasing during the analyzed period (1961–2012). Thus, the data show
a positive trend of the annual minimum discharges with a significance level α of 0.05.
The low monthly flows have, in general, the same positive trend, statistically significant for January to March and December (for α = 0.05 to α = 0.01). The exception
is given by the low flows in April to July, for which a negative trend was identified (statistically non-significant). Seasonally, the minimum discharges have upward
trends in spring (for α = 0.1), winter (for α = 0.01 in) and autumn (statistically nonsignificant), and a downward trend in summer (statistically non-significant). The
trend identified in the low flows, correlated with the seasonal frequency of floods
lead to the conclusion that for the analyzed period, the hydrological regime tends to
become more extreme in the summer for both low and high flows and attenuated in
the winter.
The frequency and the duration of low flows were determined by considering as
a threshold the discharge (Q) with 95% exceedance probability (the 5th percentile),
based on recorded mean daily discharges during 1961–2012 (Q 95% = 0.092 m
3 /s).
We considered as low flow period any period of at least 10 consecutive days with
discharges below this value. This method helps to identify the driest years for the
study area, regarding hydrological drought duration.
The decadal analysis of low flows shows an increase of their magnitude, especially in the last decade (2001–2010) and an important variation of their frequency
(expressed as a decadal number of days with discharges below Q 95% ) (Fig. 10.12a).
During the analyzed period, the intervals of dry years are 1963–1968 and 1986–1995
(Fig. 10.12b). The occurrence of low flow periods does not imply that significant
Fig. 10.12 The decadal frequency of discharges below Q 95% and decadal minimum (Q min min),
average (Q min avg) and maximum (Q min max) of mean daily discharges (a) and annual number
of low flow periods (b) at Bus , teni gauging station on Valea Cerbului River (1961–2012)