

320
L. Zaharia et al.
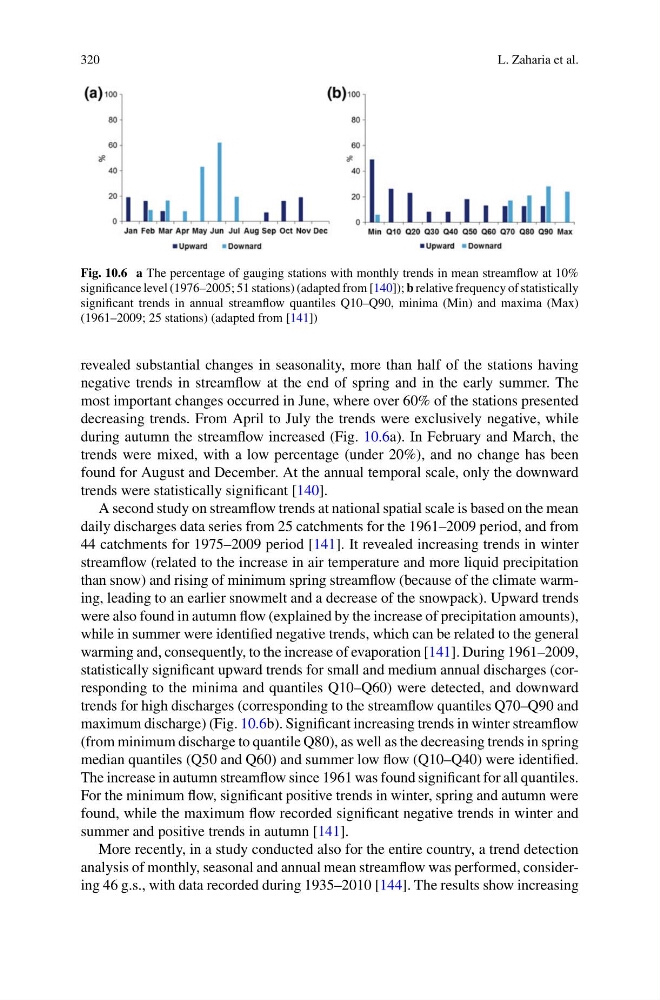
Fig. 10.6 a The percentage of gauging stations with monthly trends in mean streamflow at 10%
significance level (1976–2005; 51 stations) (adapted from [140]); b relative frequency of statistically
significant trends in annual streamflow quantiles Q10–Q90, minima (Min) and maxima (Max)
(1961–2009; 25 stations) (adapted from [141])
revealed substantial changes in seasonality, more than half of the stations having
negative trends in streamflow at the end of spring and in the early summer. The
most important changes occurred in June, where over 60% of the stations presented
decreasing trends. From April to July the trends were exclusively negative, while
during autumn the streamflow increased (Fig. 10.6a). In February and March, the
trends were mixed, with a low percentage (under 20%), and no change has been
found for August and December. At the annual temporal scale, only the downward
trends were statistically significant [140].
A second study on streamflow trends at national spatial scale is based on the mean
daily discharges data series from 25 catchments for the 1961–2009 period, and from
44 catchments for 1975–2009 period [141]. It revealed increasing trends in winter
streamflow (related to the increase in air temperature and more liquid precipitation
than snow) and rising of minimum spring streamflow (because of the climate warming, leading to an earlier snowmelt and a decrease of the snowpack). Upward trends
were also found in autumn flow (explained by the increase of precipitation amounts),
while in summer were identified negative trends, which can be related to the general
warming and, consequently, to the increase of evaporation [141]. During 1961–2009,
statistically significant upward trends for small and medium annual discharges (corresponding to the minima and quantiles Q10–Q60) were detected, and downward
trends for high discharges (corresponding to the streamflow quantiles Q70–Q90 and
maximum discharge) (Fig. 10.6b). Significant increasing trends in winter streamflow
(from minimum discharge to quantile Q80), as well as the decreasing trends in spring
median quantiles (Q50 and Q60) and summer low flow (Q10–Q40) were identified.
The increase in autumn streamflow since 1961 was found significant for all quantiles.
For the minimum flow, significant positive trends in winter, spring and autumn were
found, while the maximum flow recorded significant negative trends in winter and
summer and positive trends in autumn [141].
More recently, in a study conducted also for the entire country, a trend detection
analysis of monthly, seasonal and annual mean streamflow was performed, considering 46 g.s., with data recorded during 1935–2010 [144]. The results show increasing
L. Zaharia et al.
Fig. 10.6 a The percentage of gauging stations with monthly trends in mean streamflow at 10%
significance level (1976–2005; 51 stations) (adapted from [140]); b relative frequency of statistically
significant trends in annual streamflow quantiles Q10–Q90, minima (Min) and maxima (Max)
(1961–2009; 25 stations) (adapted from [141])
revealed substantial changes in seasonality, more than half of the stations having
negative trends in streamflow at the end of spring and in the early summer. The
most important changes occurred in June, where over 60% of the stations presented
decreasing trends. From April to July the trends were exclusively negative, while
during autumn the streamflow increased (Fig. 10.6a). In February and March, the
trends were mixed, with a low percentage (under 20%), and no change has been
found for August and December. At the annual temporal scale, only the downward
trends were statistically significant [140].
A second study on streamflow trends at national spatial scale is based on the mean
daily discharges data series from 25 catchments for the 1961–2009 period, and from
44 catchments for 1975–2009 period [141]. It revealed increasing trends in winter
streamflow (related to the increase in air temperature and more liquid precipitation
than snow) and rising of minimum spring streamflow (because of the climate warming, leading to an earlier snowmelt and a decrease of the snowpack). Upward trends
were also found in autumn flow (explained by the increase of precipitation amounts),
while in summer were identified negative trends, which can be related to the general
warming and, consequently, to the increase of evaporation [141]. During 1961–2009,
statistically significant upward trends for small and medium annual discharges (corresponding to the minima and quantiles Q10–Q60) were detected, and downward
trends for high discharges (corresponding to the streamflow quantiles Q70–Q90 and
maximum discharge) (Fig. 10.6b). Significant increasing trends in winter streamflow
(from minimum discharge to quantile Q80), as well as the decreasing trends in spring
median quantiles (Q50 and Q60) and summer low flow (Q10–Q40) were identified.
The increase in autumn streamflow since 1961 was found significant for all quantiles.
For the minimum flow, significant positive trends in winter, spring and autumn were
found, while the maximum flow recorded significant negative trends in winter and
summer and positive trends in autumn [141].
More recently, in a study conducted also for the entire country, a trend detection
analysis of monthly, seasonal and annual mean streamflow was performed, considering 46 g.s., with data recorded during 1935–2010 [144]. The results show increasing