

65
levels above the Mexican norm NOM 127 SSA1 1994 (Reyes Gómez et al. 2015).
Statistical analyses performed on the WL (and significance test) consisted of linear
regression and correlation to test for association among parameters (co-occurrence).
For the spatial analyses in land use change, efficacy of the model (EM) was determined according to Mayer and Butler (1993).
Results
Water Level (WL) Drop Rate
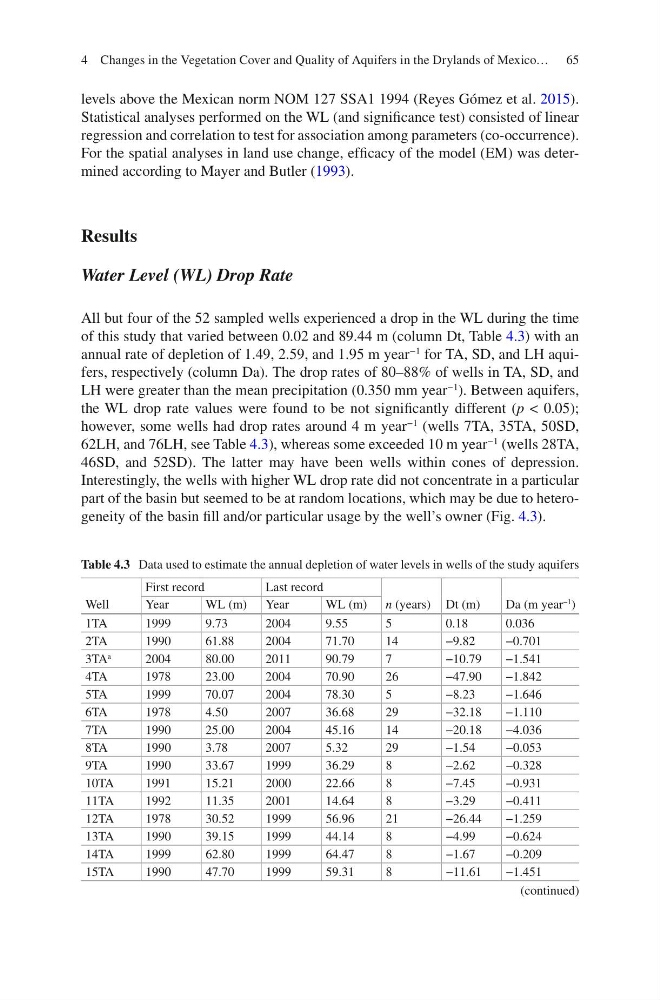
All but four of the 52 sampled wells experienced a drop in the WL during the time
of this study that varied between 0.02 and 89.44 m (column Dt, Table 4.3) with an
annual rate of depletion of 1.49, 2.59, and 1.95 m year
−1
for TA, SD, and LH aquifers, respectively (column Da). The drop rates of 80–88% of wells in TA, SD, and
LH were greater than the mean precipitation (0.350 mm year
−1
). Between aquifers,
the WL drop rate values were found to be not significantly different (p < 0.05);
however, some wells had drop rates around 4 m year
−1
(wells 7TA, 35TA, 50SD,
62LH, and 76LH, see Table 4.3), whereas some exceeded 10 m year
−1
(wells 28TA,
46SD, and 52SD). The latter may have been wells within cones of depression.
Interestingly, the wells with higher WL drop rate did not concentrate in a particular
part of the basin but seemed to be at random locations, which may be due to heterogeneity of the basin fill and/or particular usage by the well’s owner (Fig. 4.3).
Table 4.3 Data used to estimate the annual depletion of water levels in wells of the study aquifers
Well
First record
Last record
n (years) Dt (m)
Da (m year
−1
)
Year
WL (m) Year
WL (m)
1TA
1999
9.73
2004
9.55
5
0.18
0.036
2TA
1990
61.88
2004
71.70
14
−9.82
−0.701
3TA
a
2004
80.00
2011
90.79
7
−10.79
−1.541
4TA
1978
23.00
2004
70.90
26
−47.90
−1.842
5TA
1999
70.07
2004
78.30
5
−8.23
−1.646
6TA
1978
4.50
2007
36.68
29
−32.18
−1.110
7TA
1990
25.00
2004
45.16
14
−20.18
−4.036
8TA
1990
3.78
2007
5.32
29
−1.54
−0.053
9TA
1990
33.67
1999
36.29
8
−2.62
−0.328
10TA
1991
15.21
2000
22.66
8
−7.45
−0.931
11TA
1992
11.35
2001
14.64
8
−3.29
−0.411
12TA
1978
30.52
1999
56.96
21
−26.44
−1.259
13TA
1990
39.15
1999
44.14
8
−4.99
−0.624
14TA
1999
62.80
1999
64.47
8
−1.67
−0.209
15TA
1990
47.70
1999
59.31
8
−11.61
−1.451
(continued)
4 Changes in the Vegetation Cover and Quality of Aquifers in the Drylands of Mexico…
levels above the Mexican norm NOM 127 SSA1 1994 (Reyes Gómez et al. 2015).
Statistical analyses performed on the WL (and significance test) consisted of linear
regression and correlation to test for association among parameters (co-occurrence).
For the spatial analyses in land use change, efficacy of the model (EM) was determined according to Mayer and Butler (1993).
Results
Water Level (WL) Drop Rate
All but four of the 52 sampled wells experienced a drop in the WL during the time
of this study that varied between 0.02 and 89.44 m (column Dt, Table 4.3) with an
annual rate of depletion of 1.49, 2.59, and 1.95 m year
−1
for TA, SD, and LH aquifers, respectively (column Da). The drop rates of 80–88% of wells in TA, SD, and
LH were greater than the mean precipitation (0.350 mm year
−1
). Between aquifers,
the WL drop rate values were found to be not significantly different (p < 0.05);
however, some wells had drop rates around 4 m year
−1
(wells 7TA, 35TA, 50SD,
62LH, and 76LH, see Table 4.3), whereas some exceeded 10 m year
−1
(wells 28TA,
46SD, and 52SD). The latter may have been wells within cones of depression.
Interestingly, the wells with higher WL drop rate did not concentrate in a particular
part of the basin but seemed to be at random locations, which may be due to heterogeneity of the basin fill and/or particular usage by the well’s owner (Fig. 4.3).
Table 4.3 Data used to estimate the annual depletion of water levels in wells of the study aquifers
Well
First record
Last record
n (years) Dt (m)
Da (m year
−1
)
Year
WL (m) Year
WL (m)
1TA
1999
9.73
2004
9.55
5
0.18
0.036
2TA
1990
61.88
2004
71.70
14
−9.82
−0.701
3TA
a
2004
80.00
2011
90.79
7
−10.79
−1.541
4TA
1978
23.00
2004
70.90
26
−47.90
−1.842
5TA
1999
70.07
2004
78.30
5
−8.23
−1.646
6TA
1978
4.50
2007
36.68
29
−32.18
−1.110
7TA
1990
25.00
2004
45.16
14
−20.18
−4.036
8TA
1990
3.78
2007
5.32
29
−1.54
−0.053
9TA
1990
33.67
1999
36.29
8
−2.62
−0.328
10TA
1991
15.21
2000
22.66
8
−7.45
−0.931
11TA
1992
11.35
2001
14.64
8
−3.29
−0.411
12TA
1978
30.52
1999
56.96
21
−26.44
−1.259
13TA
1990
39.15
1999
44.14
8
−4.99
−0.624
14TA
1999
62.80
1999
64.47
8
−1.67
−0.209
15TA
1990
47.70
1999
59.31
8
−11.61
−1.451
(continued)
4 Changes in the Vegetation Cover and Quality of Aquifers in the Drylands of Mexico…