

297
1991–2017). Then we disaggregated, described, and briefly interpreted the results
of those changes by country and then by land property regime type for Mexico.
Given the results of both analyzes we come to the following findings and preliminary conclusions. We also outline an agenda for future work.
1. Taking into account changes in aridity indices and trends by country (Appendix
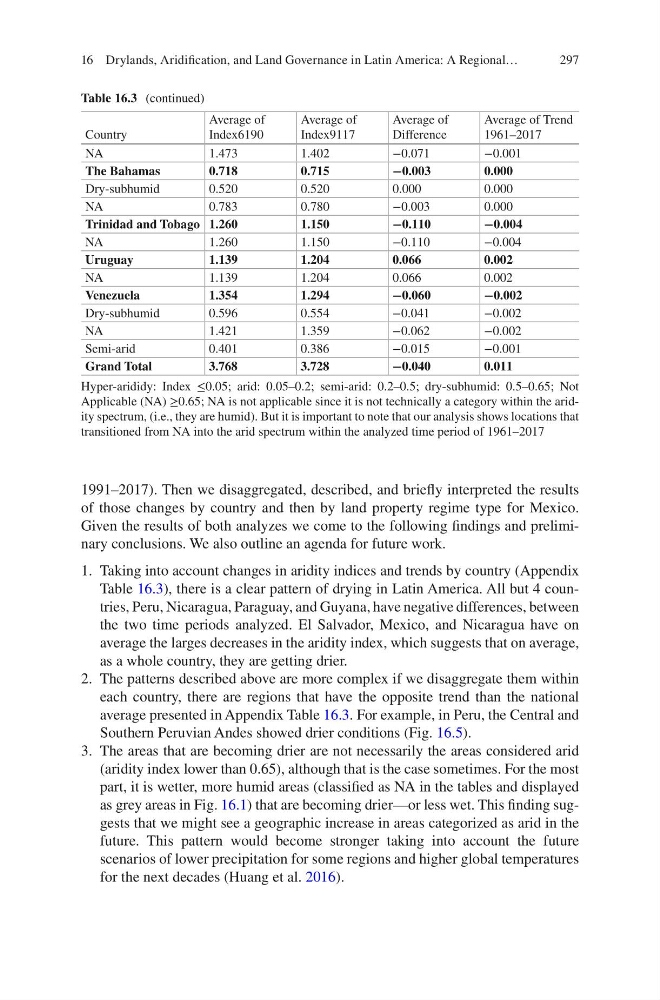
Table 16.3), there is a clear pattern of drying in Latin America. All but 4 countries, Peru, Nicaragua, Paraguay, and Guyana, have negative differences, between
the two time periods analyzed. El Salvador, Mexico, and Nicaragua have on
average the larges decreases in the aridity index, which suggests that on average,
as a whole country, they are getting drier.
2. The patterns described above are more complex if we disaggregate them within
each country, there are regions that have the opposite trend than the national
average presented in Appendix Table 16.3. For example, in Peru, the Central and
Southern Peruvian Andes showed drier conditions (Fig. 16.5).
3. The areas that are becoming drier are not necessarily the areas considered arid
(aridity index lower than 0.65), although that is the case sometimes. For the most
part, it is wetter, more humid areas (classified as NA in the tables and displayed
as grey areas in Fig. 16.1) that are becoming drier—or less wet. This finding suggests that we might see a geographic increase in areas categorized as arid in the
future. This pattern would become stronger taking into account the future
scenarios of lower precipitation for some regions and higher global temperatures
for the next decades (Huang et al. 2016).
Table 16.3 (continued)
Country
Average of
Index6190
Average of
Index9117
Average of
Difference
Average of Trend
1961–2017
NA
1.473
1.402
−0.071
−0.001
The Bahamas
0.718
0.715
−0.003
0.000
Dry-subhumid
0.520
0.520
0.000
0.000
NA
0.783
0.780
−0.003
0.000
Trinidad and Tobago 1.260
1.150
−0.110
−0.004
NA
1.260
1.150
−0.110
−0.004
Uruguay
1.139
1.204
0.066
0.002
NA
1.139
1.204
0.066
0.002
Venezuela
1.354
1.294
−0.060
−0.002
Dry-subhumid
0.596
0.554
−0.041
−0.002
NA
1.421
1.359
−0.062
−0.002
Semi-arid
0.401
0.386
−0.015
−0.001
Grand Total
3.768
3.728
−0.040
0.011
Hyper-arididy: Index ≤0.05; arid: 0.05–0.2; semi-arid: 0.2–0.5; dry-subhumid: 0.5–0.65; Not
Applicable (NA) ≥0.65; NA is not applicable since it is not technically a category within the aridity spectrum, (i.e., they are humid). But it is important to note that our analysis shows locations that
transitioned from NA into the arid spectrum within the analyzed time period of 1961–2017
16 Drylands, Aridification, and Land Governance in Latin America: A Regional…
1991–2017). Then we disaggregated, described, and briefly interpreted the results
of those changes by country and then by land property regime type for Mexico.
Given the results of both analyzes we come to the following findings and preliminary conclusions. We also outline an agenda for future work.
1. Taking into account changes in aridity indices and trends by country (Appendix
Table 16.3), there is a clear pattern of drying in Latin America. All but 4 countries, Peru, Nicaragua, Paraguay, and Guyana, have negative differences, between
the two time periods analyzed. El Salvador, Mexico, and Nicaragua have on
average the larges decreases in the aridity index, which suggests that on average,
as a whole country, they are getting drier.
2. The patterns described above are more complex if we disaggregate them within
each country, there are regions that have the opposite trend than the national
average presented in Appendix Table 16.3. For example, in Peru, the Central and
Southern Peruvian Andes showed drier conditions (Fig. 16.5).
3. The areas that are becoming drier are not necessarily the areas considered arid
(aridity index lower than 0.65), although that is the case sometimes. For the most
part, it is wetter, more humid areas (classified as NA in the tables and displayed
as grey areas in Fig. 16.1) that are becoming drier—or less wet. This finding suggests that we might see a geographic increase in areas categorized as arid in the
future. This pattern would become stronger taking into account the future
scenarios of lower precipitation for some regions and higher global temperatures
for the next decades (Huang et al. 2016).
Table 16.3 (continued)
Country
Average of
Index6190
Average of
Index9117
Average of
Difference
Average of Trend
1961–2017
NA
1.473
1.402
−0.071
−0.001
The Bahamas
0.718
0.715
−0.003
0.000
Dry-subhumid
0.520
0.520
0.000
0.000
NA
0.783
0.780
−0.003
0.000
Trinidad and Tobago 1.260
1.150
−0.110
−0.004
NA
1.260
1.150
−0.110
−0.004
Uruguay
1.139
1.204
0.066
0.002
NA
1.139
1.204
0.066
0.002
Venezuela
1.354
1.294
−0.060
−0.002
Dry-subhumid
0.596
0.554
−0.041
−0.002
NA
1.421
1.359
−0.062
−0.002
Semi-arid
0.401
0.386
−0.015
−0.001
Grand Total
3.768
3.728
−0.040
0.011
Hyper-arididy: Index ≤0.05; arid: 0.05–0.2; semi-arid: 0.2–0.5; dry-subhumid: 0.5–0.65; Not
Applicable (NA) ≥0.65; NA is not applicable since it is not technically a category within the aridity spectrum, (i.e., they are humid). But it is important to note that our analysis shows locations that
transitioned from NA into the arid spectrum within the analyzed time period of 1961–2017
16 Drylands, Aridification, and Land Governance in Latin America: A Regional…