

142
Spatial Variability of Drought Using PCA
PCA on 12-month SPI was calculated for the 117 locations to identify spatial similitudes of drought over 420 months from 1979 to 2013 in the study area. The first
three rotated components (RPCs) explained about 87.9% of total variance, and each
principal component explained 68.6%, 13.9%, and 5.4% of the variance, respectively. The rotated loading for three RPCs for the drought time series was computed
and interpolated for the 117 locations to classify and characterize the spatial
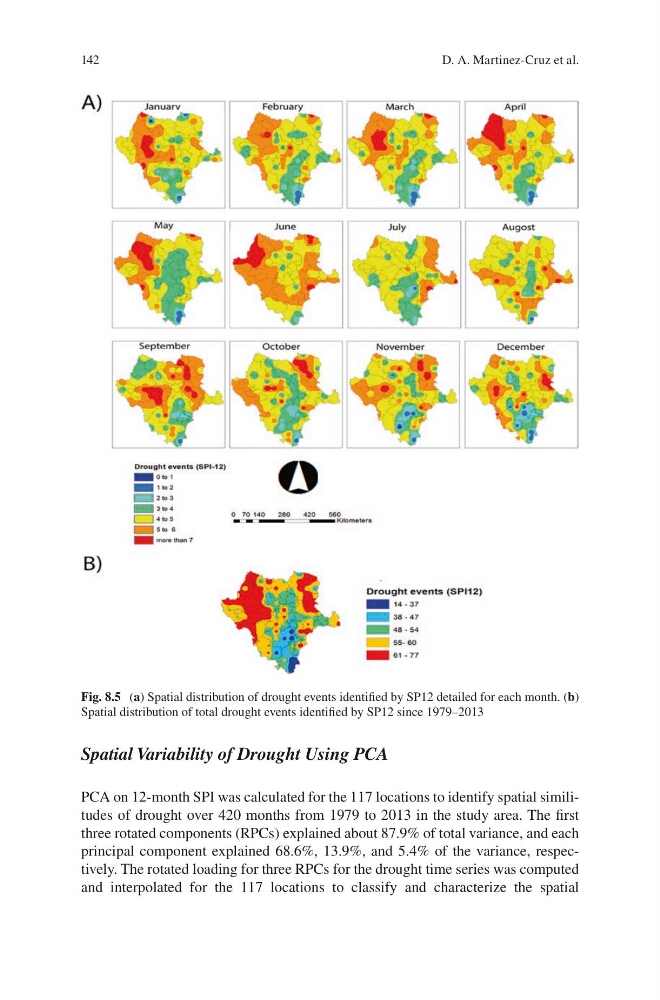
Fig. 8.5 (a) Spatial distribution of drought events identified by SP12 detailed for each month. (b)
Spatial distribution of total drought events identified by SP12 since 1979–2013
D. A. Martinez-Cruz et al.
Spatial Variability of Drought Using PCA
PCA on 12-month SPI was calculated for the 117 locations to identify spatial similitudes of drought over 420 months from 1979 to 2013 in the study area. The first
three rotated components (RPCs) explained about 87.9% of total variance, and each
principal component explained 68.6%, 13.9%, and 5.4% of the variance, respectively. The rotated loading for three RPCs for the drought time series was computed
and interpolated for the 117 locations to classify and characterize the spatial
Fig. 8.5 (a) Spatial distribution of drought events identified by SP12 detailed for each month. (b)
Spatial distribution of total drought events identified by SP12 since 1979–2013
D. A. Martinez-Cruz et al.