

140
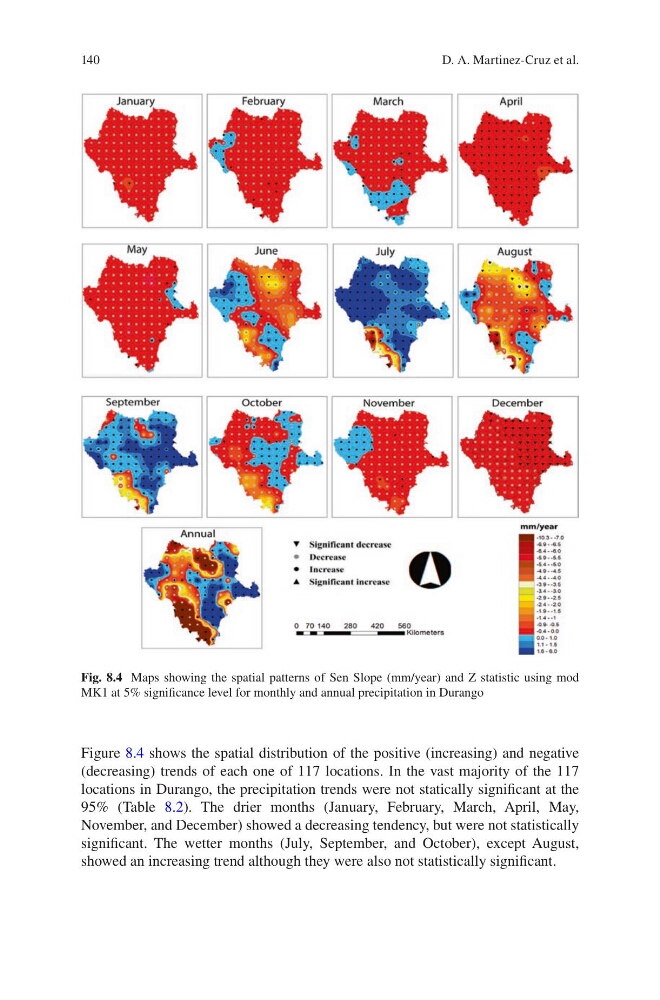
Figure 8.4 shows the spatial distribution of the positive (increasing) and negative
(decreasing) trends of each one of 117 locations. In the vast majority of the 117
locations in Durango, the precipitation trends were not statically significant at the
95% (Table 8.2). The drier months (January, February, March, April, May,
November, and December) showed a decreasing tendency, but were not statistically
significant. The wetter months (July, September, and October), except August,
showed an increasing trend although they were also not statistically significant.
Fig. 8.4 Maps showing the spatial patterns of Sen Slope (mm/year) and Z statistic using mod
MK1 at 5% significance level for monthly and annual precipitation in Durango
D. A. Martinez-Cruz et al.
Figure 8.4 shows the spatial distribution of the positive (increasing) and negative
(decreasing) trends of each one of 117 locations. In the vast majority of the 117
locations in Durango, the precipitation trends were not statically significant at the
95% (Table 8.2). The drier months (January, February, March, April, May,
November, and December) showed a decreasing tendency, but were not statistically
significant. The wetter months (July, September, and October), except August,
showed an increasing trend although they were also not statistically significant.
Fig. 8.4 Maps showing the spatial patterns of Sen Slope (mm/year) and Z statistic using mod
MK1 at 5% significance level for monthly and annual precipitation in Durango
D. A. Martinez-Cruz et al.