

percent and thirty-six percent of the annual NH 3 and NO x emissions, respectively, in
China are exported outside of China (Zhao et al. 2017a). N deposition declines
rapidly downwind of the continent. The fluxes are in the range of 2–11 kg N ha
À1
year
À1 to the eastern China seas, as simulated by the CMAQ regional model (Zhang
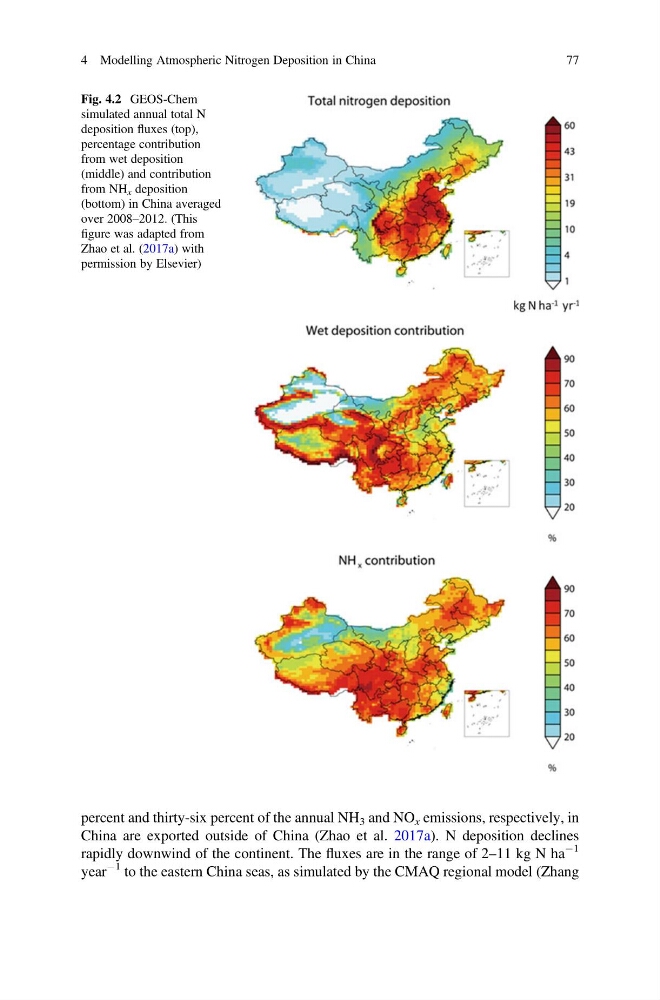
Fig. 4.2 GEOS-Chem
simulated annual total N
deposition fluxes (top),
percentage contribution
from wet deposition
(middle) and contribution
from NH x deposition
(bottom) in China averaged
over 2008–2012. (This
figure was adapted from
Zhao et al. (2017a) with
permission by Elsevier)
4 Modelling Atmospheric Nitrogen Deposition in China
77
China are exported outside of China (Zhao et al. 2017a). N deposition declines
rapidly downwind of the continent. The fluxes are in the range of 2–11 kg N ha
À1
year
À1 to the eastern China seas, as simulated by the CMAQ regional model (Zhang
Fig. 4.2 GEOS-Chem
simulated annual total N
deposition fluxes (top),
percentage contribution
from wet deposition
(middle) and contribution
from NH x deposition
(bottom) in China averaged
over 2008–2012. (This
figure was adapted from
Zhao et al. (2017a) with
permission by Elsevier)
4 Modelling Atmospheric Nitrogen Deposition in China
77