

A recent work by Zhao et al. (2017a) evaluated the model results with an ensemble
of surface measurements and concluded an annual N deposition of 16.4 kg N ha
À1
year
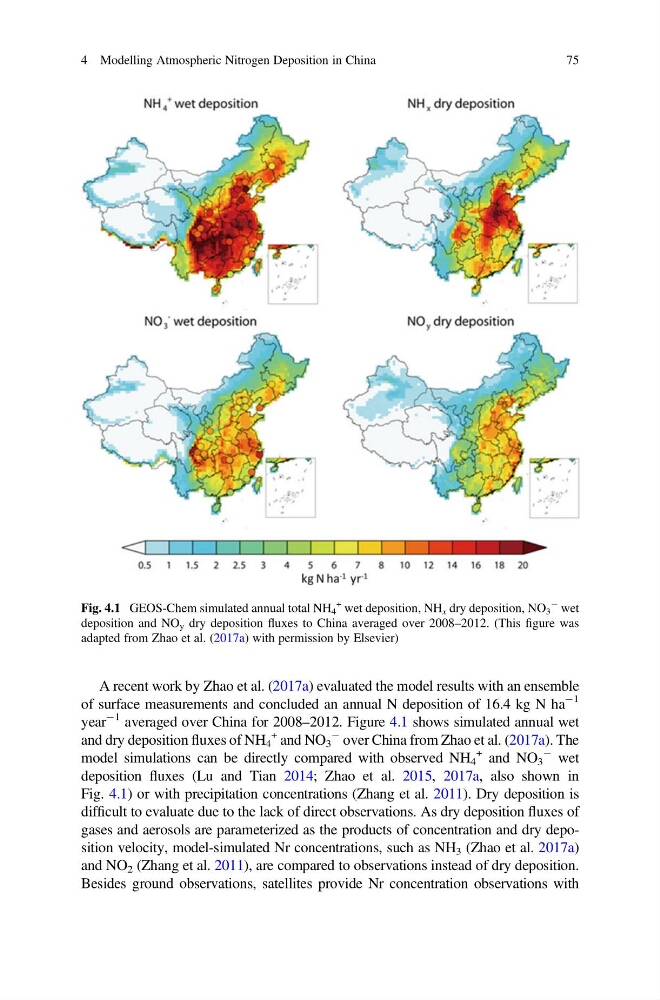
À1 averaged over China for 2008–2012. Figure 4.1 shows simulated annual wet
and dry deposition fluxes of NH 4
+ and NO 3
À over China from Zhao et al. (2017a). The
model simulations can be directly compared with observed NH 4
+ and NO 3
À wet
deposition fluxes (Lu and Tian 2014; Zhao et al. 2015, 2017a, also shown in
Fig. 4.1) or with precipitation concentrations (Zhang et al. 2011). Dry deposition is
difficult to evaluate due to the lack of direct observations. As dry deposition fluxes of
gases and aerosols are parameterized as the products of concentration and dry deposition velocity, model-simulated Nr concentrations, such as NH 3 (Zhao et al. 2017a)
and NO 2 (Zhang et al. 2011), are compared to observations instead of dry deposition.
Besides ground observations, satellites provide Nr concentration observations with
Fig. 4.1 GEOS-Chem simulated annual total NH 4
+ wet deposition, NH x dry deposition, NO 3
À wet
deposition and NO y dry deposition fluxes to China averaged over 2008–2012. (This figure was
adapted from Zhao et al. (2017a) with permission by Elsevier)
4 Modelling Atmospheric Nitrogen Deposition in China
75
of surface measurements and concluded an annual N deposition of 16.4 kg N ha
À1
year
À1 averaged over China for 2008–2012. Figure 4.1 shows simulated annual wet
and dry deposition fluxes of NH 4
+ and NO 3
À over China from Zhao et al. (2017a). The
model simulations can be directly compared with observed NH 4
+ and NO 3
À wet
deposition fluxes (Lu and Tian 2014; Zhao et al. 2015, 2017a, also shown in
Fig. 4.1) or with precipitation concentrations (Zhang et al. 2011). Dry deposition is
difficult to evaluate due to the lack of direct observations. As dry deposition fluxes of
gases and aerosols are parameterized as the products of concentration and dry deposition velocity, model-simulated Nr concentrations, such as NH 3 (Zhao et al. 2017a)
and NO 2 (Zhang et al. 2011), are compared to observations instead of dry deposition.
Besides ground observations, satellites provide Nr concentration observations with
Fig. 4.1 GEOS-Chem simulated annual total NH 4
+ wet deposition, NH x dry deposition, NO 3
À wet
deposition and NO y dry deposition fluxes to China averaged over 2008–2012. (This figure was
adapted from Zhao et al. (2017a) with permission by Elsevier)
4 Modelling Atmospheric Nitrogen Deposition in China
75